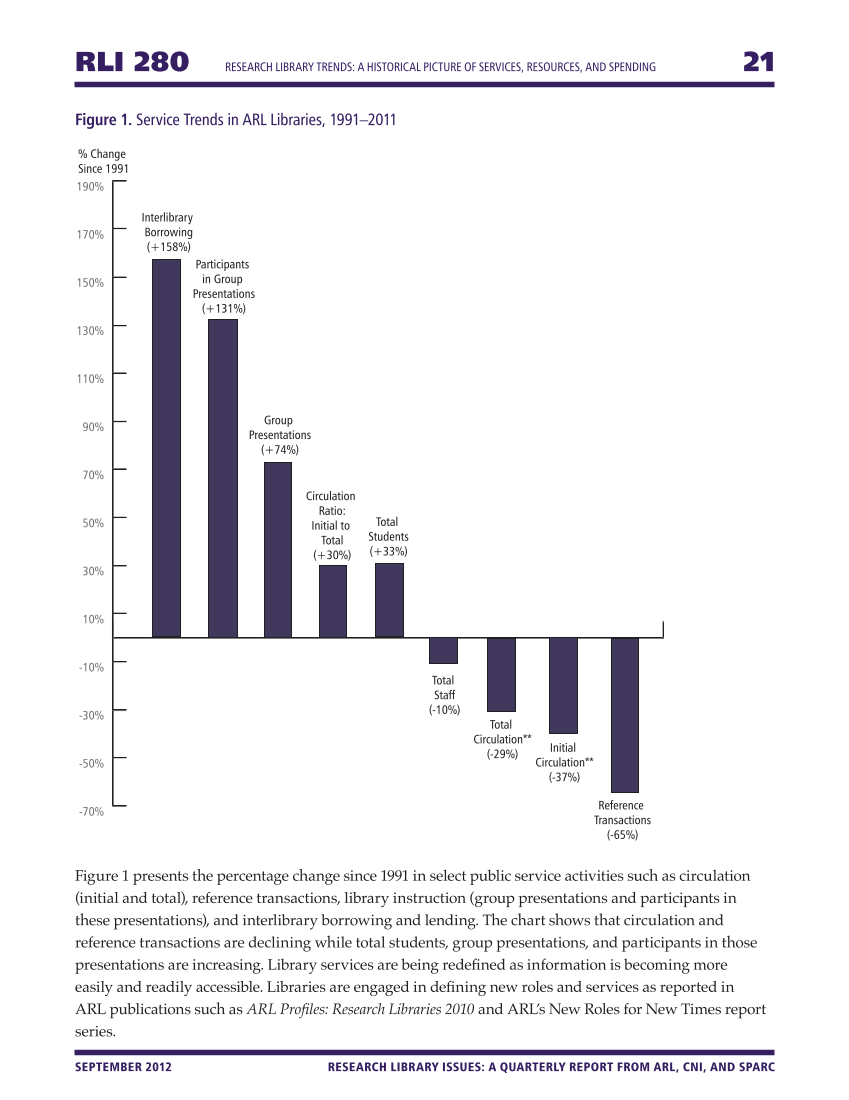
RLI 280 Research Library Trends: A Historical Picture of Services, Resources, and Spending 21 SEPTEMBER 2012 RESEARCH LIBRARY ISSUES: A QUARTERLY REPORT FROM ARL, CNI, AND SPARC Figure 1. Service Trends in ARL Libraries, 1991–2011 Figure 1 presents the percentage change since 1991 in select public service activities such as circulation (initial and total), reference transactions, library instruction (group presentations and participants in these presentations), and interlibrary borrowing and lending. The chart shows that circulation and reference transactions are declining while total students, group presentations, and participants in those presentations are increasing. Library services are being redefined as information is becoming more easily and readily accessible. Libraries are engaged in defining new roles and services as reported in ARL publications such as ARL Profiles: Research Libraries 2010 and ARL’s New Roles for New Times report series. -70% -50% -30% -10% 10% 30% 50% 70% 90% 110% 130% 150% 170% 190% Interlibrary Borrowing (+158%) Reference Transactions (-65%) Initial Circulation** (-37%) Total Circulation** (-29%) Total Staff (-10%) Total Students (+33%) Circulation Ratio: Initial to Total (+30%) Group Presentations (+74%) Participants in Group Presentations (+131%) % Change Since 1991
Help


