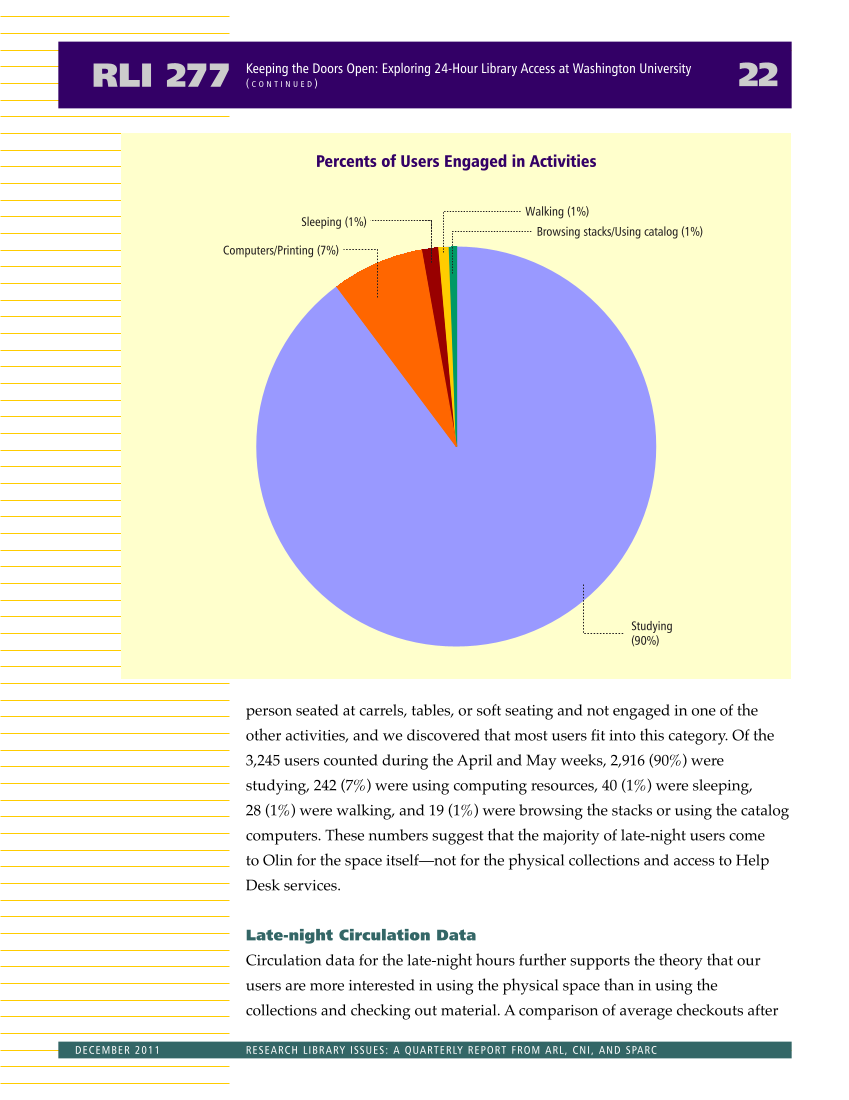
person seated at carrels, tables, or soft seating and not engaged in one of the other activities, and we discovered that most users fit into this category. Of the 3,245 users counted during the April and May weeks, 2,916 (90%) were studying, 242 (7%) were using computing resources, 40 (1%) were sleeping, 28 (1%) were walking, and 19 (1%) were browsing the stacks or using the catalog computers. These numbers suggest that the majority of late-night users come to Olin for the space itself—not for the physical collections and access to Help Desk services. Late-night Circulation Data Circulation data for the late-night hours further supports the theory that our users are more interested in using the physical space than in using the collections and checking out material. A comparison of average checkouts after RLI 277 22 Keeping the Doors Open: Exploring 24-Hour Library Access at Washington University ( C O N T I N U E D ) DECEMBER 2011 RESEARCH LIBRARY ISSUES: A QUARTERLY REPORT FROM ARL, CNI, AND SPARC Studying (90%) Computers/Printing (7%) Sleeping (1%) Walking (1%) Browsing stacks/Using catalog (1%) Percents of Users Engaged in Activities
Help


