39 SPEC Kit 352: Collection Assessment
If your library has used a “System developed locally/in-house,” please briefly describe the system.
N=17
A relational database with SQL
A SharePoint-based site called New Serial Title System. A local system, the Serials Extract File,
PubMed, PMC
Customization of Google Analytics of events to track use of resources.
Data files stored on library Intranet and/or collaborative cloud storage system. Faculty interest survey
for journals developed based upon instance here and conducted in 2014.
Database for analysis of journal big deal titles
DataMart: a self-service report application that uses batch-collected data from various systems,
primarily our ILS (Aleph).
It is a locally developed ERM.
Library Online Course Reserves (LOCR)
Metridoc: https://metridoc.library.upenn.edu
Our library has developed an integrated serials review system in collaboration with several
departments. The system uses a combination of a MySQL database and web services to display
serials information to the university community and to record title-level feedback regarding
possible cancellations.
Reporting system querying data from institutional data warehouse.
SORA, RMOA
The Cornell University Library Web Logs Statistics Tool (CUL Logs) is based in part on the conceptual
framework of “bibliomining” (http://www.bibliomining.com/). One of the key features is a method to
protect patron privacy by replacing information in data logs that can identify an individual (such as an
IP address) with location or patron type surrogates.
There are multiple systems we have developed in-house to help us evaluate acquisitions and collections.
Some are simple systems that report expenditures in all categories for individual selectors and some are
complicated systems that show journal usage and overlap for all journal titles in our collection.
Tool for locally storing and delivering usage statistics on the web
Using Excel spreadsheets for indexing and displaying data and our local file servers for storage.
We have been using Python for data cleanup and d3.js for data visualization. We also make heavy use of
Google Sheets.
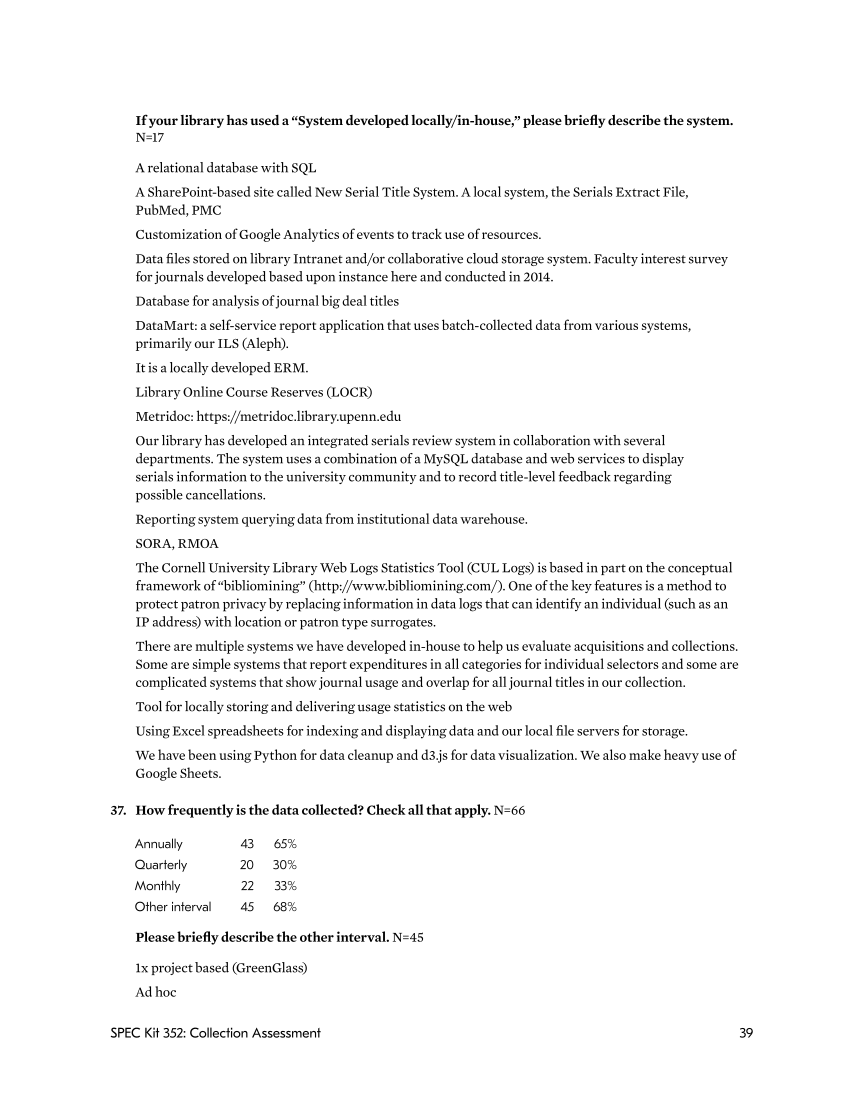
37. How frequently is the data collected? Check all that apply. N=66
Annually 43 65%
Quarterly 20 30%
Monthly 22 33%
Other interval 45 68%
Please briefly describe the other interval. N=45
1x project based (GreenGlass)
Ad hoc


