70 · ARL Statistics 2010–2011
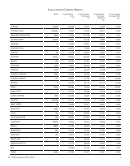
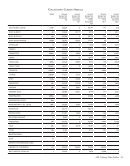
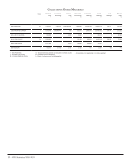
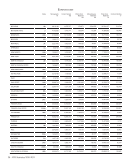
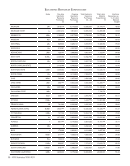
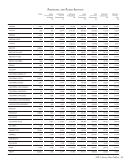
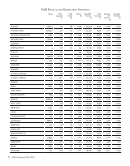
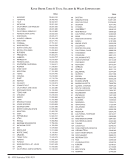
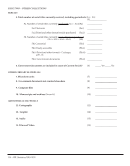
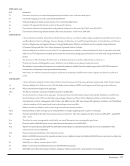
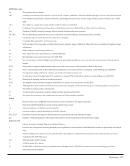
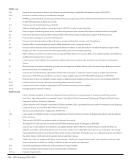
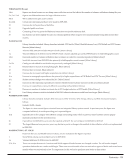
Analysis of Selected Variables of University Libraries, 2010–2011
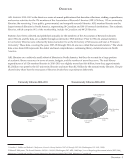
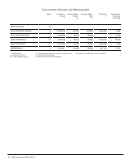
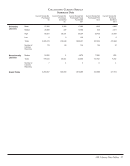
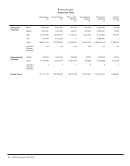
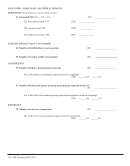
The percentages and ratios below are select indicators that describe the condition of ARL university libraries. The
high and low figures indicate the range, while the mean and median indicate the central tendency of the distributions
for ARL university libraries. Note that a distribution is normal when the mean and the median figures are identical.
If the mean is larger than the median, then the is positively skewed, and if the opposite is true, the
distribution is negatively skewed.
Category
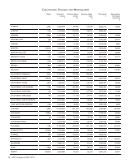
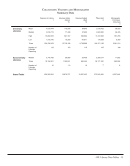
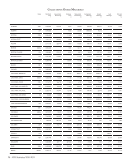
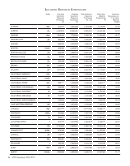
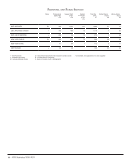
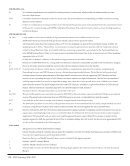
The percentages and ratios below are select indicators that describe the condition of ARL university libraries. The high and low
figures indicate the range, while the mean and median indicate the central tendency of the distributions for ARL university libraries.
Note that a distribution is normal when the mean andistributionfigures d the median are identical. If the mean is larger than the median then the
distribution is positively skewed, and if the opposite is true the distribution is negatively skewed.
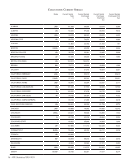
High Mean Median Low Number of
Libraries
Reporting
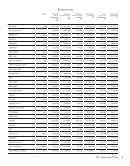
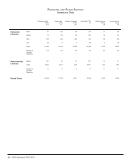
Professional Staff as a precent of Total Staff 62.16 34.99 34.25 10.64 115
Support Staff as a precent of Total Staff 70.09 44.61 44.08 15.23 115
Student Assistant Staff as a precent of Total Staff 65.63 20.58 21.28 0.58 114
Ratio of Professional to Support Staff (excluding Student Assistant
Staff)
4.06 0.87 0.75 0.39 115
Ratio of Items Loaned to Items Borrowed 5.16 1.39 1.19 0.21 115
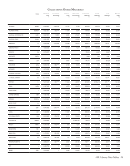
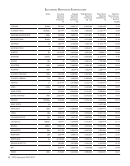
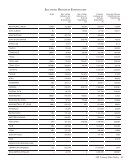
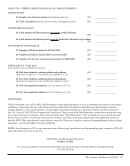
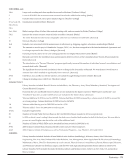
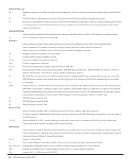
Serials Expenditures as a precent of Total Library Materials
Expenditures
92.20 70.46 70.49 10.41 114
Monograph Expenditures as a precent of Total Library Materials
Expenditures
50.55 19.65 17.62 3.87 114
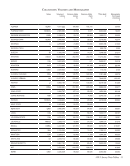
Total Library Materials Expenditures as a precent of Total Library
Expenditures
62.40 44.46 45.06 24.48 115
Contract Binding as a precent of Total Library Expenditures 1.60 0.36 0.33 0.00 115
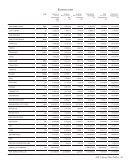
Salary and Wages Expenditures as a precent of Total Library
Expenditures
60.19 44.28 43.00 30.11 115
Other Operating Expenditures as a precent of Total Library
Expenditures
29.07 10.90 10.32 2.42 115
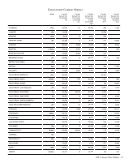
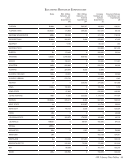
Unit costs of Monographs (per volume) 143.79 57.82 55.65 2.47 106
Unit costs of Serials (per title) 473.15 139.18 129.25 27.75 113
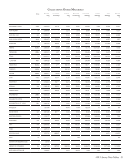
Library Expenditures per Faculty 57,339.73 17,864.80 16,162.70 7,162.39 115
Library Expenditures per Full-Time Student 6,267.99 1,287.98 951.70 425.63 115
Library Expenditures per Full-Time Graduate Student 18,720.91 5,203.61 4,836.11 2,320.55 115
Library Expenditures per Full-Time User 5,637.67 1,183.02 893.52 407.37 115
Library Expenditures per User 5,637.67 1,040.91 755.99 321.82 115
Library Expenditures per PhD Awarded 362,970.30 89,959.88 81,019.45 28,714.91 115
Library Staff per PhD Awarded 5.18 0.90 0.78 0.24 115
Professional Library Staff per PhD Awarded 1.51 0.31 0.26 0.09 115
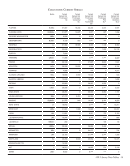
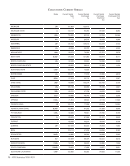
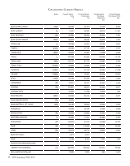
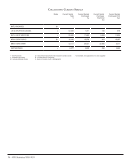
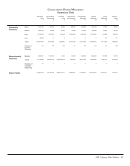
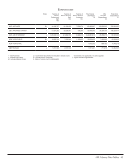
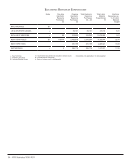
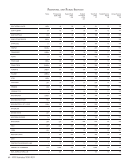
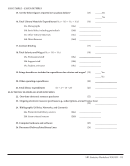
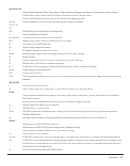
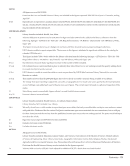
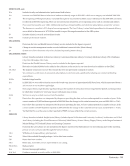
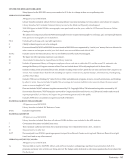
Analysis of Selected Variables of University Libraries, 2010–2011
The percentages and ratios below are select indicators that describe the condition of ARL university libraries. The
high and low figures indicate the range, while the mean and median indicate the central tendency of the distributions
for ARL university libraries. Note that a distribution is normal when the mean and the median figures are identical.
If the mean is larger than the median, then the is positively skewed, and if the opposite is true, the
distribution is negatively skewed.
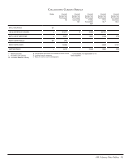
Category
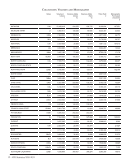
The percentages and ratios below are select indicators that describe the condition of ARL university libraries. The high and low
figures indicate the range, while the mean and median indicate the central tendency of the distributions for ARL university libraries.
Note that a distribution is normal when the mean andistributionfigures d the median are identical. If the mean is larger than the median then the
distribution is positively skewed, and if the opposite is true the distribution is negatively skewed.
High Mean Median Low Number of
Libraries
Reporting
Professional Staff as a precent of Total Staff 62.16 34.99 34.25 10.64 115
Support Staff as a precent of Total Staff 70.09 44.61 44.08 15.23 115
Student Assistant Staff as a precent of Total Staff 65.63 20.58 21.28 0.58 114
Ratio of Professional to Support Staff (excluding Student Assistant
Staff)
4.06 0.87 0.75 0.39 115
Ratio of Items Loaned to Items Borrowed 5.16 1.39 1.19 0.21 115
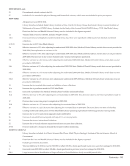
Serials Expenditures as a precent of Total Library Materials
Expenditures
92.20 70.46 70.49 10.41 114
Monograph Expenditures as a precent of Total Library Materials
Expenditures
50.55 19.65 17.62 3.87 114
Total Library Materials Expenditures as a precent of Total Library
Expenditures
62.40 44.46 45.06 24.48 115
Contract Binding as a precent of Total Library Expenditures 1.60 0.36 0.33 0.00 115
Salary and Wages Expenditures as a precent of Total Library
Expenditures
60.19 44.28 43.00 30.11 115
Other Operating Expenditures as a precent of Total Library
Expenditures
29.07 10.90 10.32 2.42 115
Unit costs of Monographs (per volume) 143.79 57.82 55.65 2.47 106
Unit costs of Serials (per title) 473.15 139.18 129.25 27.75 113
Library Expenditures per Faculty 57,339.73 17,864.80 16,162.70 7,162.39 115
Library Expenditures per Full-Time Student 6,267.99 1,287.98 951.70 425.63 115
Library Expenditures per Full-Time Graduate Student 18,720.91 5,203.61 4,836.11 2,320.55 115
Library Expenditures per Full-Time User 5,637.67 1,183.02 893.52 407.37 115
Library Expenditures per User 5,637.67 1,040.91 755.99 321.82 115
Library Expenditures per PhD Awarded 362,970.30 89,959.88 81,019.45 28,714.91 115
Library Staff per PhD Awarded 5.18 0.90 0.78 0.24 115
Professional Library Staff per PhD Awarded 1.51 0.31 0.26 0.09 115