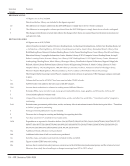
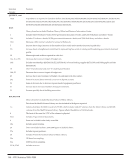
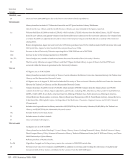
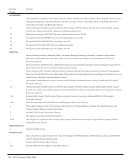
16 · ARL Statistics 2008–2009
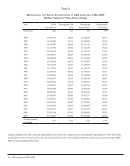
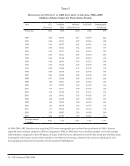
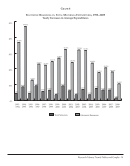
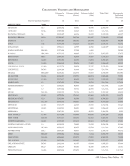
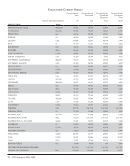
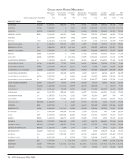
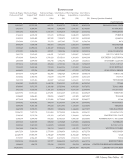
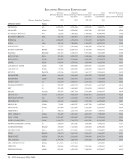
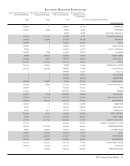
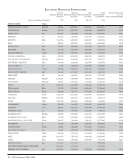
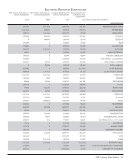
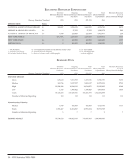
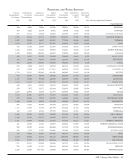
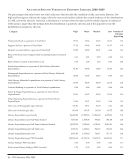
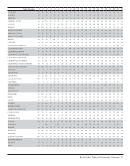
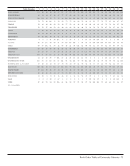
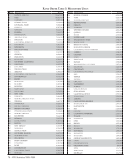
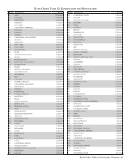
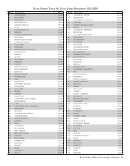
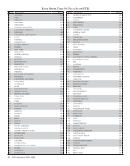
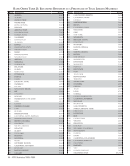
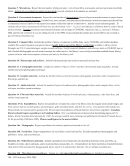
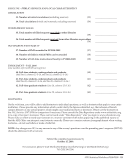
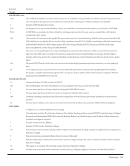
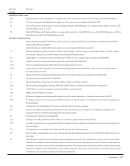
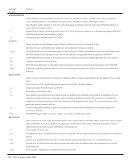
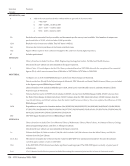
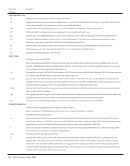
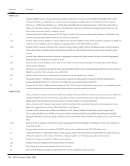
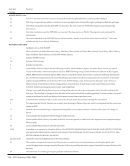
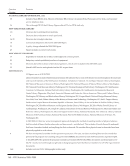
Table 5
Resources per Student in ARL University Libraries, 1986–2009
Median of Ratio Values for Time-Series Trends
Year ILL:
Borrowed
Volumes
Held
Volumes
Added (Gross)
Total Staff Monographs
Purchased
(Libraries) (102) (103) (103) (103) (57)
1986 0.42 123.18 4.17 0.0159 2.20
1987 0.44 125.31 3.92 0.0164 1.88
1988 0.44 128.27 3.82 0.0161 1.66
1989 0.50 130.04 3.84 0.0162 1.77
1990 0.55 133.51 3.86 0.0155 1.83
1991 0.63 137.11 4.04 0.0154 1.86
1992 0.62 137.68 3.95 0.0153 1.58
1993 0.68 146.02 3.76 0.0152 1.49
1994 0.74 151.20 4.07 0.0152 1.55
1995 0.80 154.00 4.37 0.0147 1.59
1996 0.89 158.10 3.78 0.0145 1.48
1997 0.89 159.40 4.03 0.0142 1.52
1998 0.97 159.24 4.06 0.0143 1.44
1999 1.05 159.37 4.00 0.0142 1.42
2000 1.13 157.74 3.82 0.0139 1.63
2001 1.16 155.71 3.89 0.0136 1.69
2002 1.14 155.04 3.87 0.0131 1.54
2003 1.14 156.41 3.52 0.0125 1.47
2004 1.20 151.49 3.45 0.0120 1.53
2005 1.22 157.93 3.30 0.0118 1.42
2006 1.22 160.05 3.26 0.0117 1.64
2007 1.13 159.49 3.49 0.0114 1.54
2008 1.19 162.87 3.22 0.0110 1.40
2009 1.24 165.49 3.59 0.0110 1.56
Average annual
%change
5.0% 1.4% -0.7% -1.7% -1.5%
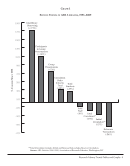
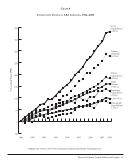
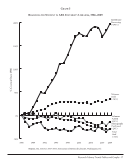
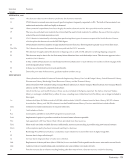
In 2008–2009, ARL libraries were acquiring 29% fewer monographs per student than purchased in 1986. Libraries
reported fewer staff per student in 2009 as compared to 1986: in 2009, there was a median number of 11 total staff per
1,000 students, compared to the 1986 figure of 16 per 1,000. However, libraries have not let this trend prevent them from
meeting the information needs of their students: interlibrary borrowing, volumes held, volumes added gross, and
monographs purchased all increased over the respective 2008 figures.
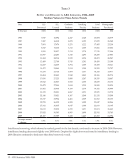
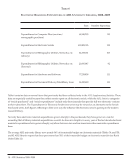
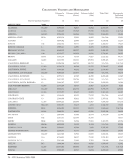
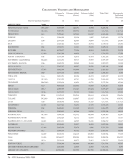
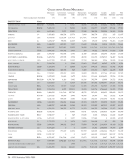
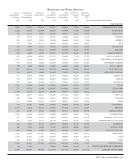
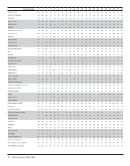
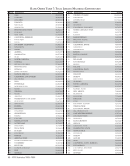
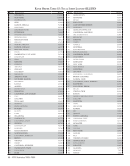
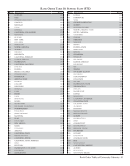
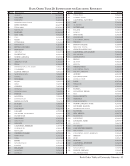
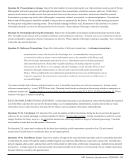
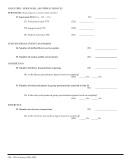
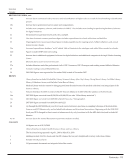
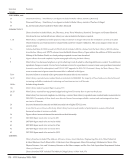
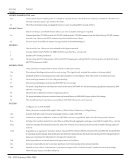
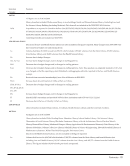
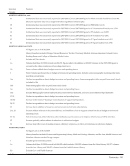
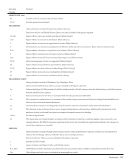
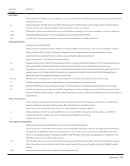
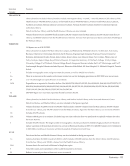
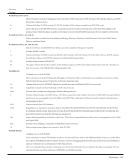
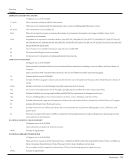
Table 5
Resources per Student in ARL University Libraries, 1986–2009
Median of Ratio Values for Time-Series Trends
Year ILL:
Borrowed
Volumes
Held
Volumes
Added (Gross)
Total Staff Monographs
Purchased
(Libraries) (102) (103) (103) (103) (57)
1986 0.42 123.18 4.17 0.0159 2.20
1987 0.44 125.31 3.92 0.0164 1.88
1988 0.44 128.27 3.82 0.0161 1.66
1989 0.50 130.04 3.84 0.0162 1.77
1990 0.55 133.51 3.86 0.0155 1.83
1991 0.63 137.11 4.04 0.0154 1.86
1992 0.62 137.68 3.95 0.0153 1.58
1993 0.68 146.02 3.76 0.0152 1.49
1994 0.74 151.20 4.07 0.0152 1.55
1995 0.80 154.00 4.37 0.0147 1.59
1996 0.89 158.10 3.78 0.0145 1.48
1997 0.89 159.40 4.03 0.0142 1.52
1998 0.97 159.24 4.06 0.0143 1.44
1999 1.05 159.37 4.00 0.0142 1.42
2000 1.13 157.74 3.82 0.0139 1.63
2001 1.16 155.71 3.89 0.0136 1.69
2002 1.14 155.04 3.87 0.0131 1.54
2003 1.14 156.41 3.52 0.0125 1.47
2004 1.20 151.49 3.45 0.0120 1.53
2005 1.22 157.93 3.30 0.0118 1.42
2006 1.22 160.05 3.26 0.0117 1.64
2007 1.13 159.49 3.49 0.0114 1.54
2008 1.19 162.87 3.22 0.0110 1.40
2009 1.24 165.49 3.59 0.0110 1.56
Average annual
%change
5.0% 1.4% -0.7% -1.7% -1.5%
In 2008–2009, ARL libraries were acquiring 29% fewer monographs per student than purchased in 1986. Libraries
reported fewer staff per student in 2009 as compared to 1986: in 2009, there was a median number of 11 total staff per
1,000 students, compared to the 1986 figure of 16 per 1,000. However, libraries have not let this trend prevent them from
meeting the information needs of their students: interlibrary borrowing, volumes held, volumes added gross, and
monographs purchased all increased over the respective 2008 figures.