ARL Library Data Tables · 63
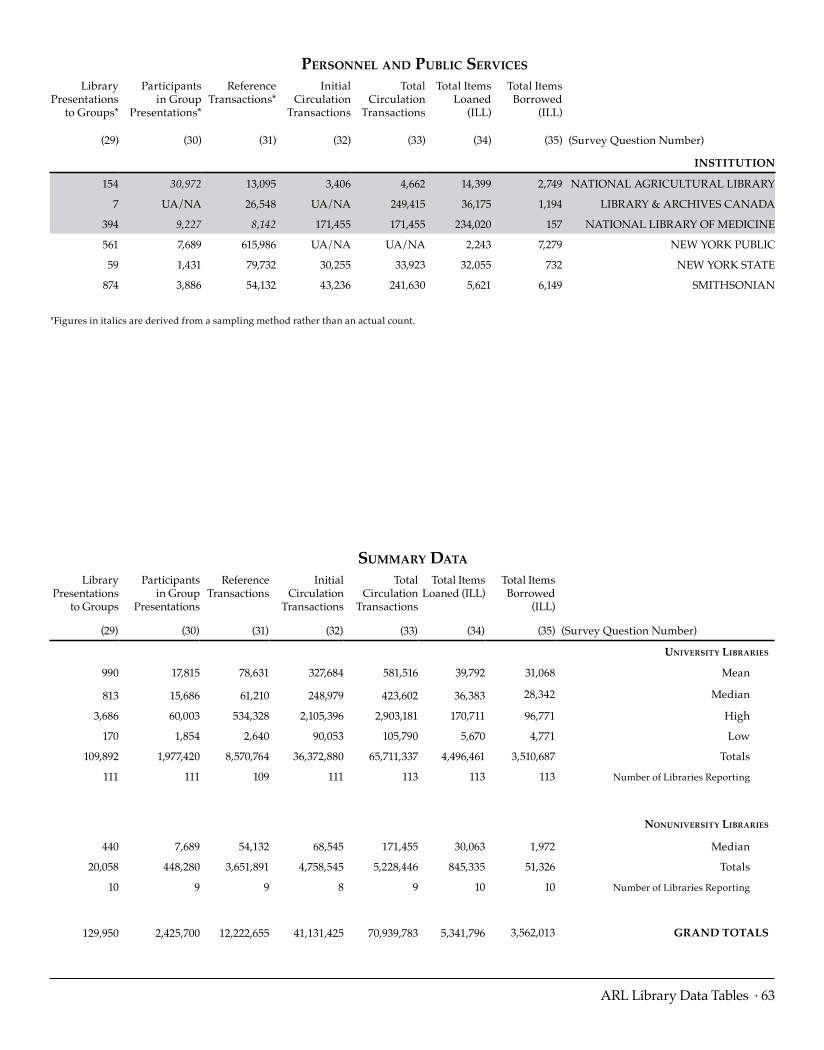
Personnel and Public Services
Library
Presentations
to Groups*
Participants
in Group
Presentations*
Reference
Transactions*
Initial
Circulation
Transactions
Total
Circulation
Transactions
Total Items
Loaned
(ILL)
Total Items
Borrowed
(ILL)
(29) (30) (31) (32) (33) (34) (35) (Survey Question Number)
INSTITUTION
154 30,972 13,095 3,406 4,662 14,399 2,749 NATIONAL AGRICULTURAL LIBRARY
7 UA/NA 26,548 UA/NA 249,415 36,175 1,194 LIBRARY &ARCHIVES CANADA
394 9,227 8,142 171,455 171,455 234,020 157 NATIONAL LIBRARY OF MEDICINE
561 7,689 615,986 UA/NA UA/NA 2,243 7,279 NEW YORK PUBLIC
59 1,431 79,732 30,255 33,923 32,055 732 NEW YORK STATE
874 3,886 54,132 43,236 241,630 5,621 6,149 SMITHSONIAN
*Figures in italics are derived from a sampling method rather than an actual count.
Summary Data
Library
Presentations
to Groups
Participants
in Group
Presentations
Reference
Transactions
Initial
Circulation
Transactions
Total
Circulation
Transactions
Total Items
Loaned (ILL)
Total Items
Borrowed
(ILL)
(29) (30) (31) (32) (33) (34) (35) (Survey Question Number)
University Libraries
990 17,815 78,631 327,684 581,516 39,792 31,068 Mean
813 15,686 61,210 248,979 423,602 36,383 28,342 Median
3,686 60,003 534,328 2,105,396 2,903,181 170,711 96,771 High
170 1,854 2,640 90,053 105,790 5,670 4,771 Low
109,892 1,977,420 8,570,764 36,372,880 65,711,337 4,496,461 3,510,687 Totals
111 111 109 111 113 113 113 Number of Libraries Reporting
Nonuniversity Libraries
440 7,689 54,132 68,545 171,455 30,063 1,972 Median
20,058 448,280 3,651,891 4,758,545 5,228,446 845,335 51,326 Totals
10 9 9 8 9 10 10 Number of Libraries Reporting
129,950 2,425,700 12,222,655 41,131,425 70,939,783 5,341,796 3,562,013 GRAND TOTALS


