8 · ARL Statistics 2006–2007
Table 1
Service Trends in ARL Libraries, 1991–2007
Median Values for Time-Series Trends
Year ILL:
Borrowed
Group
Pres.
Participants
In Pres.
Reference
Trans.
Initial
Circ.
Total
Circ.
Ratio of Circ.
Init./Tot.
Total
Staff
Total
Students
(Libraries) (103) (84) (82) (79) (36) (80) (34) (105) (103)
1991 10,397 508 7,137 125,103 296,964 509,673 1.26 271 18,290
1992 11,362 526 7,154 132,549 342,989 554,579 1.27 265 18,273
1993 12,489 616 7,688 136,115 343,293 568,628 1.32 262 18,450
1994 14,007 568 7,831 147,582 369,996 572,749 1.31 264 18,305
1995 14,472 687 8,461 147,023 347,144 578,989 1.32 267 18,209
1996 15,278 719 8,410 155,336 336,481 560,244 1.39 264 18,320
1997 16,264 687 9,218 149,659 348,157 542,438 1.37 273 18,166
1998 17,656 698 9,462 132,850 354,924 514,574 1.37 273 18,335
1999 18,942 711 9,406 128,696 300,923 514,087 1.38 277 18,609
2000 20,475 722 9,596 115,636 273,231 482,542 1.42 267 18,908
2001 21,902 669 10,121 104,409 265,195 467,277 1.48 269 19,102
2002 21,339 776 11,350 95,910 251,146 462,223 1.51 279 19,925
2003 22,146 806 12,516 89,150 248,689 479,733 1.57 277 21,132
2004 25,737 757 12,864 84,546 261,526 496,369 1.60 273 21,562
2005 25,729 803 13,782 65,168 250,971 473,216 1.58 267 22,047
2006 27,412 833 13,051 67,697 267,213 466,403 1.52 267 22,618
2007 26,813 830 14,417 61,703 222,037 456,597 1.59 266 22,874
Average annual
%change
6.1% 3.1% 4.5% -4.3% -1.8 -0.7 1.5% -0.1 1.4%
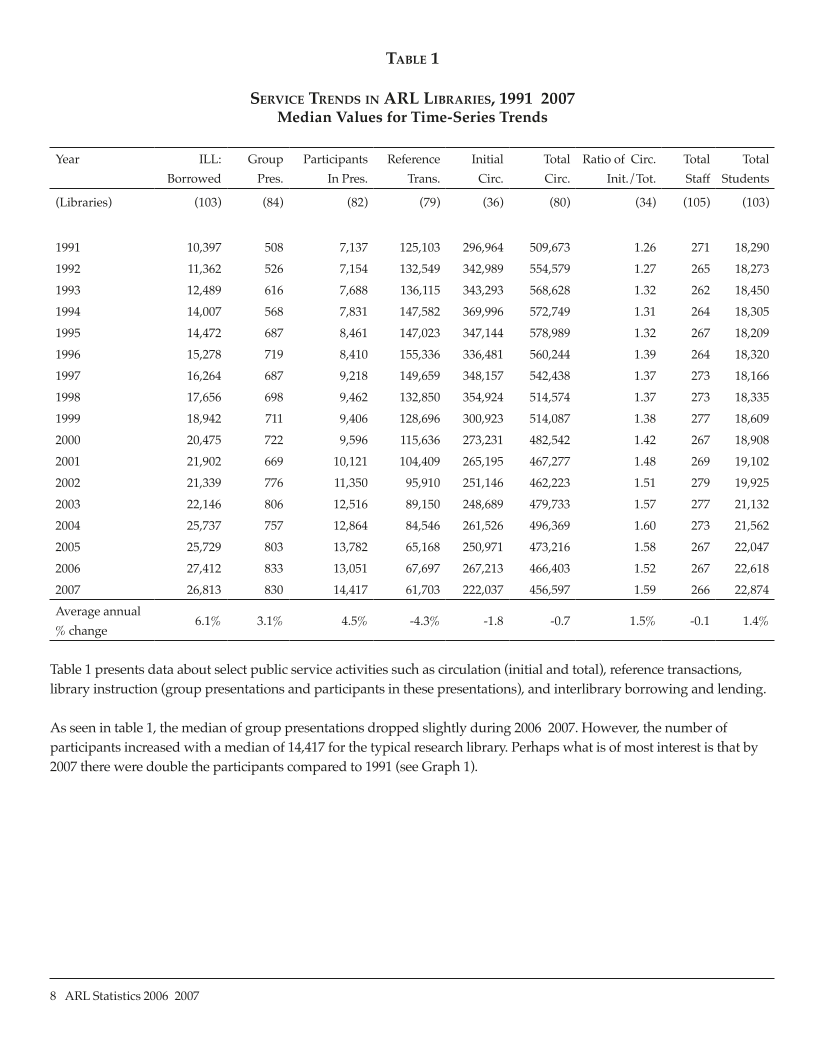
Table 1 presents data about select public service activities such as circulation (initial and total), reference transactions,
library instruction (group presentations and participants in these presentations), and interlibrary borrowing and lending.
As seen in table 1, the median of group presentations dropped slightly during 2006–2007. However, the number of
participants increased with a median of 14,417 for the typical research library. Perhaps what is of most interest is that by
2007 there were double the participants compared to 1991 (see Graph 1).
Table 1
Service Trends in ARL Libraries, 1991–2007
Median Values for Time-Series Trends
Year ILL:
Borrowed
Group
Pres.
Participants
In Pres.
Reference
Trans.
Initial
Circ.
Total
Circ.
Ratio of Circ.
Init./Tot.
Total
Staff
Total
Students
(Libraries) (103) (84) (82) (79) (36) (80) (34) (105) (103)
1991 10,397 508 7,137 125,103 296,964 509,673 1.26 271 18,290
1992 11,362 526 7,154 132,549 342,989 554,579 1.27 265 18,273
1993 12,489 616 7,688 136,115 343,293 568,628 1.32 262 18,450
1994 14,007 568 7,831 147,582 369,996 572,749 1.31 264 18,305
1995 14,472 687 8,461 147,023 347,144 578,989 1.32 267 18,209
1996 15,278 719 8,410 155,336 336,481 560,244 1.39 264 18,320
1997 16,264 687 9,218 149,659 348,157 542,438 1.37 273 18,166
1998 17,656 698 9,462 132,850 354,924 514,574 1.37 273 18,335
1999 18,942 711 9,406 128,696 300,923 514,087 1.38 277 18,609
2000 20,475 722 9,596 115,636 273,231 482,542 1.42 267 18,908
2001 21,902 669 10,121 104,409 265,195 467,277 1.48 269 19,102
2002 21,339 776 11,350 95,910 251,146 462,223 1.51 279 19,925
2003 22,146 806 12,516 89,150 248,689 479,733 1.57 277 21,132
2004 25,737 757 12,864 84,546 261,526 496,369 1.60 273 21,562
2005 25,729 803 13,782 65,168 250,971 473,216 1.58 267 22,047
2006 27,412 833 13,051 67,697 267,213 466,403 1.52 267 22,618
2007 26,813 830 14,417 61,703 222,037 456,597 1.59 266 22,874
Average annual
%change
6.1% 3.1% 4.5% -4.3% -1.8 -0.7 1.5% -0.1 1.4%
Table 1 presents data about select public service activities such as circulation (initial and total), reference transactions,
library instruction (group presentations and participants in these presentations), and interlibrary borrowing and lending.
As seen in table 1, the median of group presentations dropped slightly during 2006–2007. However, the number of
participants increased with a median of 14,417 for the typical research library. Perhaps what is of most interest is that by
2007 there were double the participants compared to 1991 (see Graph 1).


