19
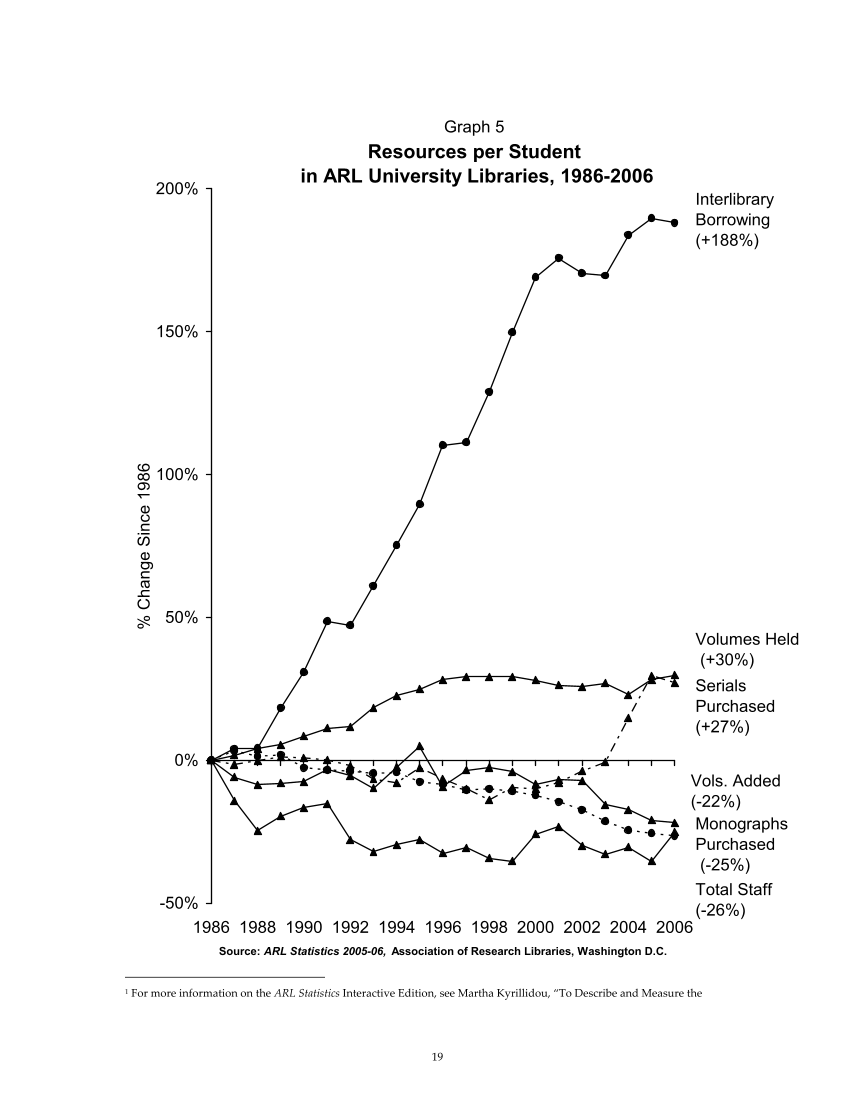
Graph 5
Resources per Student
in ARL University Libraries, 1986-2006
-50%
0%
50%
100%
150%
200%
1986 1988 1990 1992 1994 1996 1998 2000 2002 2004 2006
Source: ARL Statistics 2005-06, Association of Research Libraries, Washington D.C.
Interlibrary
Borrowing
(+188%)
Volumes Held
(+30%)
Vols. Added
(-22%)
Total Staff
(-26%)
Serials
Purchased
(+27%)
Monographs
Purchased
(-25%)
1 For more information on the ARL Statistics Interactive Edition, see Martha Kyrillidou, “To Describe and Measure the
%
Change
Since
1986


