11
-50%
-30%
-10%
10%
30%
50%
70%
90%
110%
130%
150%
170%
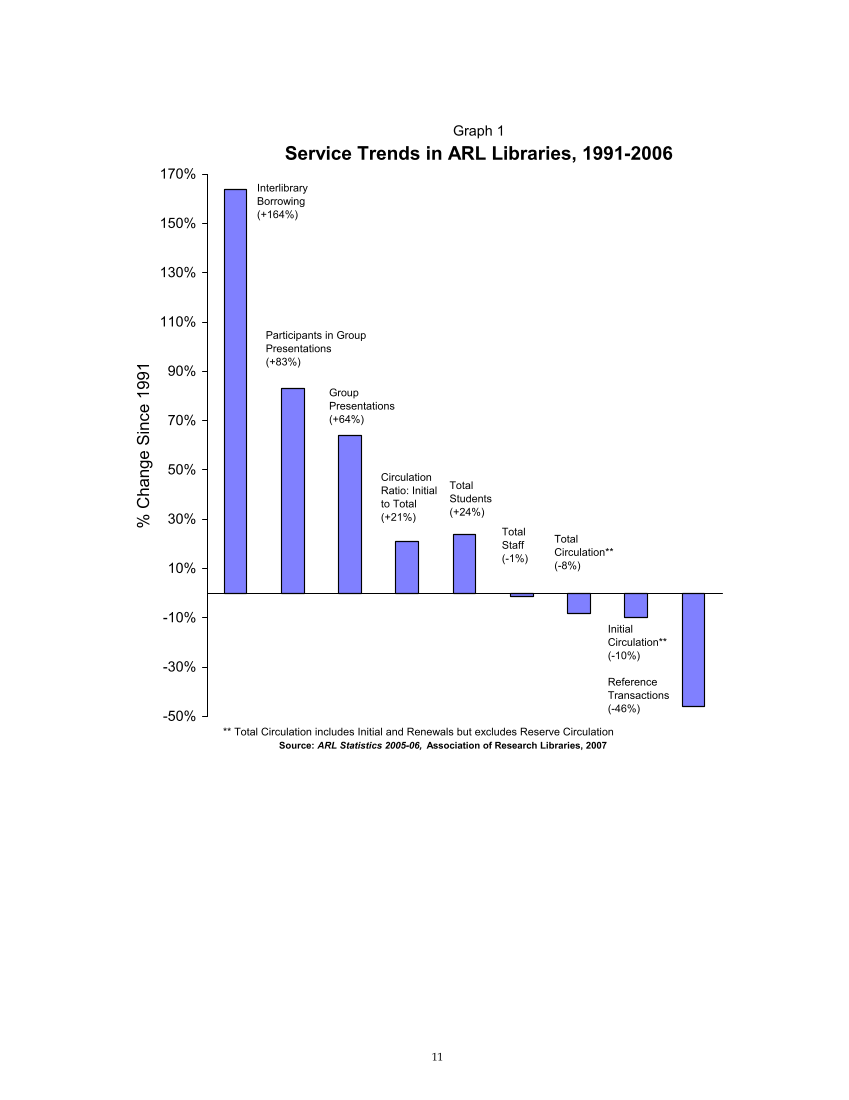
Source: ARL Statistics 2005-06, Association of Research Libraries, 2007
Graph 1
Service Trends in ARL Libraries, 1991-2006
Interlibrary
Borrowing
(+164%)
Group
Presentations
(+64%)
Reference
Transactions
(-46%)
Total
Circulation**
(-8%)
Total
Staff
(-1%)
Total
Students
(+24%)
**Total Circulation includes Initial and Renewals but excludes Reserve Circulation
Participants in Group
Presentations
(+83%)
Circulation
Ratio: Initial
to Total
(+21%)
Initial
Circulation**
(-10%)
%
Change
Since
1991
-50%
-30%
-10%
10%
30%
50%
70%
90%
110%
130%
150%
170%
Source: ARL Statistics 2005-06, Association of Research Libraries, 2007
Graph 1
Service Trends in ARL Libraries, 1991-2006
Interlibrary
Borrowing
(+164%)
Group
Presentations
(+64%)
Reference
Transactions
(-46%)
Total
Circulation**
(-8%)
Total
Staff
(-1%)
Total
Students
(+24%)
**Total Circulation includes Initial and Renewals but excludes Reserve Circulation
Participants in Group
Presentations
(+83%)
Circulation
Ratio: Initial
to Total
(+21%)
Initial
Circulation**
(-10%)
%
Change
Since
1991


