20
EXPENDITURES FOR ELECTRONIC MATERIALS
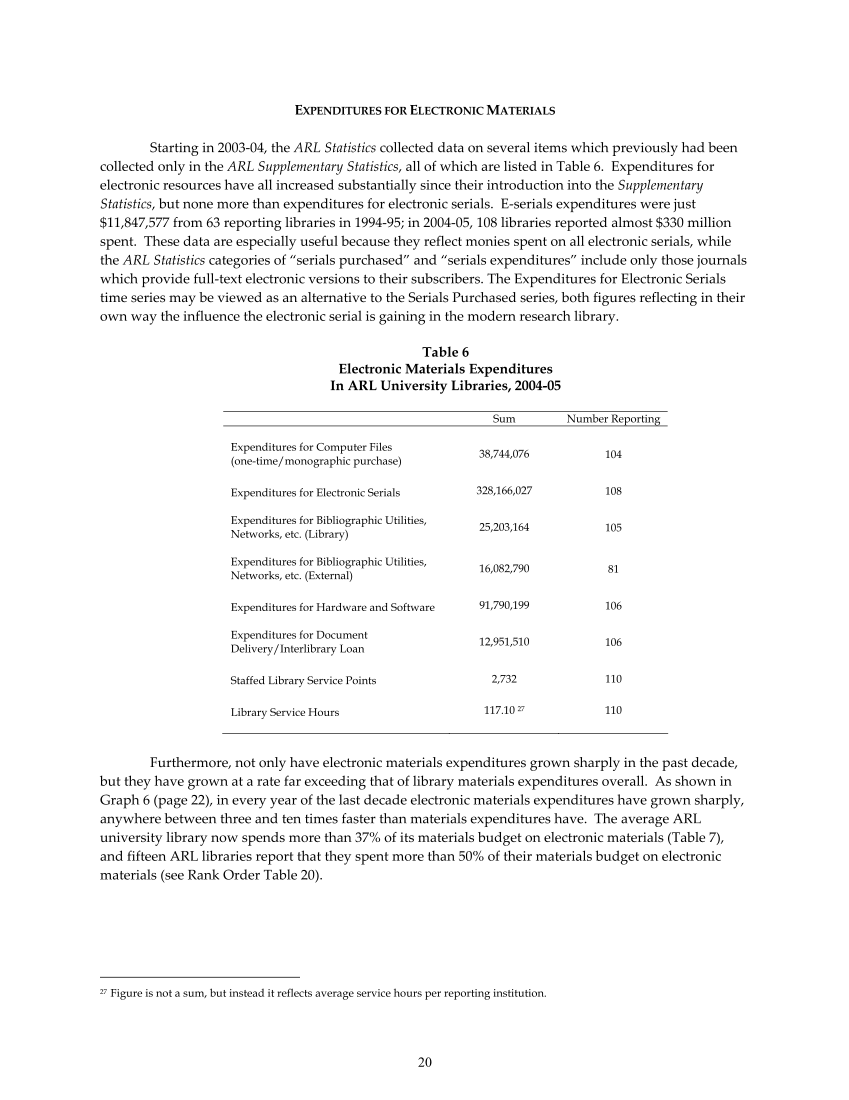
Starting in 2003‐04, the ARL Statistics collected data on several items which previously had been
collected only in the ARL Supplementary Statistics, all of which are listed in Table 6. Expenditures for
electronic resources have all increased substantially since their introduction into the Supplementary
Statistics, but none more than expenditures for electronic serials. E‐serials expenditures were just
$11,847,577 from 63 reporting libraries in 1994‐95 in 2004‐05, 108 libraries reported almost $330 million
spent. These data are especially useful because they reflect monies spent on all electronic serials, while
the ARL Statistics categories of “serials purchased” and “serials expenditures” include only those journals
which provide full‐text electronic versions to their subscribers. The Expenditures for Electronic Serials
time series may be viewed as an alternative to the Serials Purchased series, both figures reflecting in their
own way the influence the electronic serial is gaining in the modern research library.
Table 6
Electronic Materials Expenditures
In ARL University Libraries, 2004-05
Sum Number Reporting
Expenditures for Computer Files
(one-time/monographic purchase)
38,744,076 104
Expenditures for Electronic Serials 328,166,027 108
Expenditures for Bibliographic Utilities,
Networks, etc. (Library)
25,203,164 105
Expenditures for Bibliographic Utilities,
Networks, etc. (External)
16,082,790 81
Expenditures for Hardware and Software 91,790,199 106
Expenditures for Document
Delivery/Interlibrary Loan
12,951,510 106
Staffed Library Service Points 2,732 110
Library Service Hours 117.10 27 110
Furthermore, not only have electronic materials expenditures grown sharply in the past decade,
but they have grown at a rate far exceeding that of library materials expenditures overall. As shown in
Graph 6 (page 22), in every year of the last decade electronic materials expenditures have grown sharply,
anywhere between three and ten times faster than materials expenditures have. The average ARL
university library now spends more than 37% of its materials budget on electronic materials (Table 7),
and fifteen ARL libraries report that they spent more than 50% of their materials budget on electronic
materials (see Rank Order Table 20).
27 Figure is not a sum, but instead it reflects average service hours per reporting institution.
EXPENDITURES FOR ELECTRONIC MATERIALS
Starting in 2003‐04, the ARL Statistics collected data on several items which previously had been
collected only in the ARL Supplementary Statistics, all of which are listed in Table 6. Expenditures for
electronic resources have all increased substantially since their introduction into the Supplementary
Statistics, but none more than expenditures for electronic serials. E‐serials expenditures were just
$11,847,577 from 63 reporting libraries in 1994‐95 in 2004‐05, 108 libraries reported almost $330 million
spent. These data are especially useful because they reflect monies spent on all electronic serials, while
the ARL Statistics categories of “serials purchased” and “serials expenditures” include only those journals
which provide full‐text electronic versions to their subscribers. The Expenditures for Electronic Serials
time series may be viewed as an alternative to the Serials Purchased series, both figures reflecting in their
own way the influence the electronic serial is gaining in the modern research library.
Table 6
Electronic Materials Expenditures
In ARL University Libraries, 2004-05
Sum Number Reporting
Expenditures for Computer Files
(one-time/monographic purchase)
38,744,076 104
Expenditures for Electronic Serials 328,166,027 108
Expenditures for Bibliographic Utilities,
Networks, etc. (Library)
25,203,164 105
Expenditures for Bibliographic Utilities,
Networks, etc. (External)
16,082,790 81
Expenditures for Hardware and Software 91,790,199 106
Expenditures for Document
Delivery/Interlibrary Loan
12,951,510 106
Staffed Library Service Points 2,732 110
Library Service Hours 117.10 27 110
Furthermore, not only have electronic materials expenditures grown sharply in the past decade,
but they have grown at a rate far exceeding that of library materials expenditures overall. As shown in
Graph 6 (page 22), in every year of the last decade electronic materials expenditures have grown sharply,
anywhere between three and ten times faster than materials expenditures have. The average ARL
university library now spends more than 37% of its materials budget on electronic materials (Table 7),
and fifteen ARL libraries report that they spent more than 50% of their materials budget on electronic
materials (see Rank Order Table 20).
27 Figure is not a sum, but instead it reflects average service hours per reporting institution.


