15
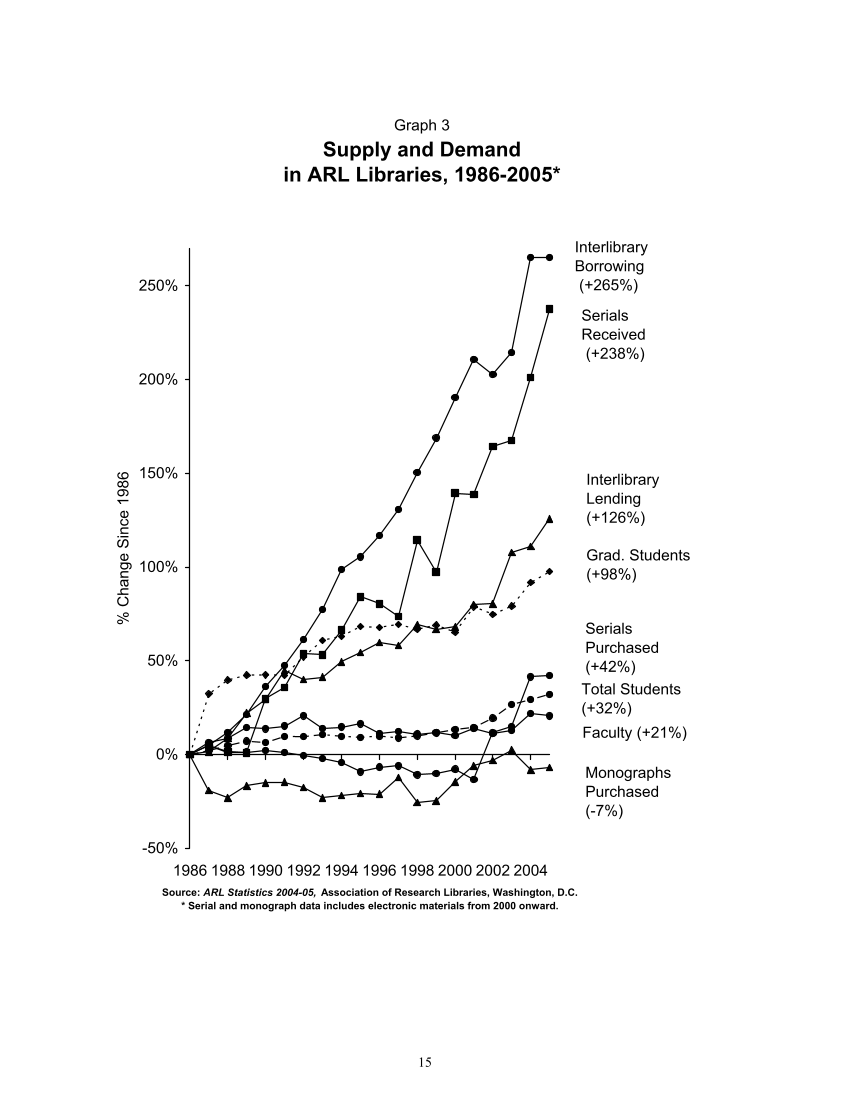
Graph 3
Supply and Demand
in ARL Libraries, 1986-2005*
-50%
0%
50%
100%
150%
200%
250%
1986 1988 1990 1992 1994 1996 1998 2000 2002 2004
Source: ARL Statistics 2004-05, Association of Research Libraries, Washington, D.C.
*Serial and monograph data includes electronic materials from 2000 onward.
Interlibrary
Borrowing
(+265%)
Interlibrary
Lending
(+126%)
Grad. Students
(+98%)
Faculty (+21%)
Total Students
(+32%)
Serials
Purchased
(+42%)
Monographs
Purchased
(-7%)
Serials
Received
(+238%)
%
Change
Since
1986


