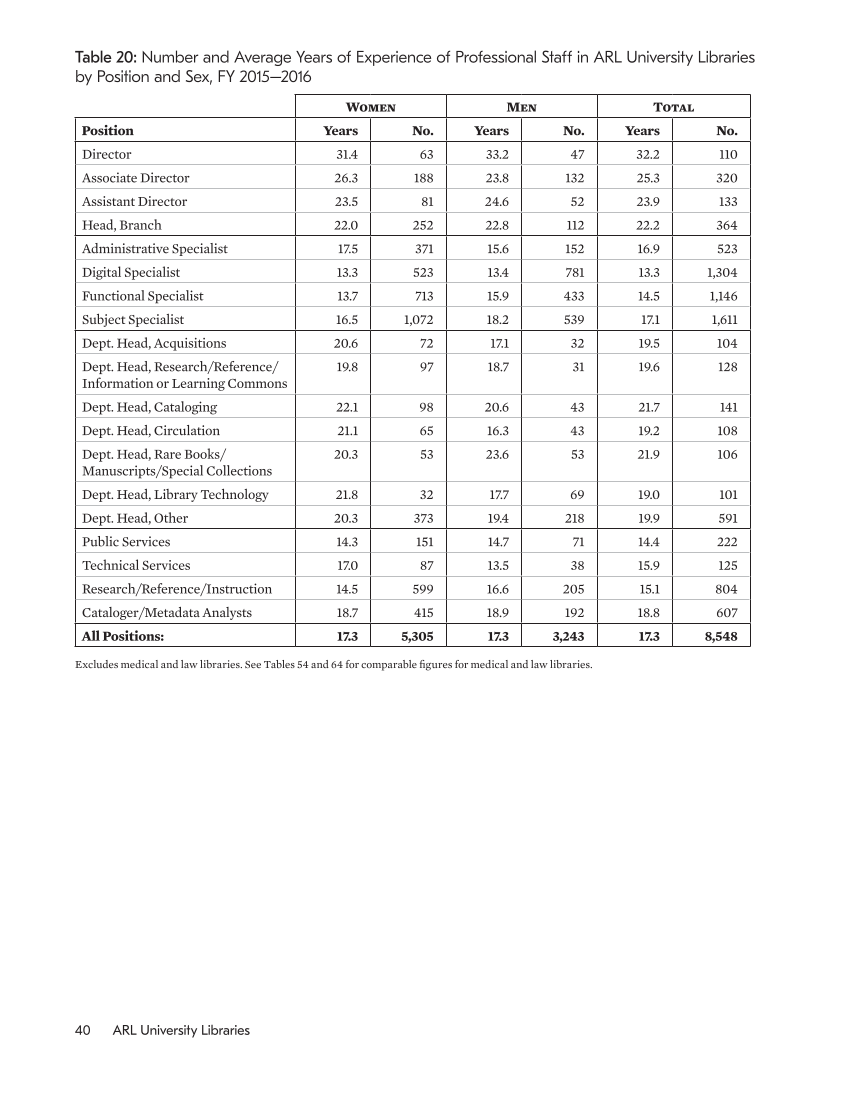
40 ARL University Libraries Table 20: Number and Average Years of Experience of Professional Staff in ARL University Libraries by Position and Sex, FY 2015–2016 Women Men Total Position Years No. Years No. Years No. Director 31.4 63 33.2 47 32.2 110 Associate Director 26.3 188 23.8 132 25.3 320 Assistant Director 23.5 81 24.6 52 23.9 133 Head, Branch 22.0 252 22.8 112 22.2 364 Administrative Specialist 17.5 371 15.6 152 16.9 523 Digital Specialist 13.3 523 13.4 781 13.3 1,304 Functional Specialist 13.7 713 15.9 433 14.5 1,146 Subject Specialist 16.5 1,072 18.2 539 17.1 1,611 Dept. Head, Acquisitions 20.6 72 17.1 32 19.5 104 Dept. Head, Research/Reference/ Information or Learning Commons 19.8 97 18.7 31 19.6 128 Dept. Head, Cataloging 22.1 98 20.6 43 21.7 141 Dept. Head, Circulation 21.1 65 16.3 43 19.2 108 Dept. Head, Rare Books/ Manuscripts/Special Collections 20.3 53 23.6 53 21.9 106 Dept. Head, Library Technology 21.8 32 17.7 69 19.0 101 Dept. Head, Other 20.3 373 19.4 218 19.9 591 Public Services 14.3 151 14.7 71 14.4 222 Technical Services 17.0 87 13.5 38 15.9 125 Research/Reference/Instruction 14.5 599 16.6 205 15.1 804 Cataloger/Metadata Analysts 18.7 415 18.9 192 18.8 607 All Positions: 17.3 5,305 17.3 3,243 17.3 8,548 Excludes medical and law libraries. See Tables 54 and 64 for comparable figures for medical and law libraries.
Help


