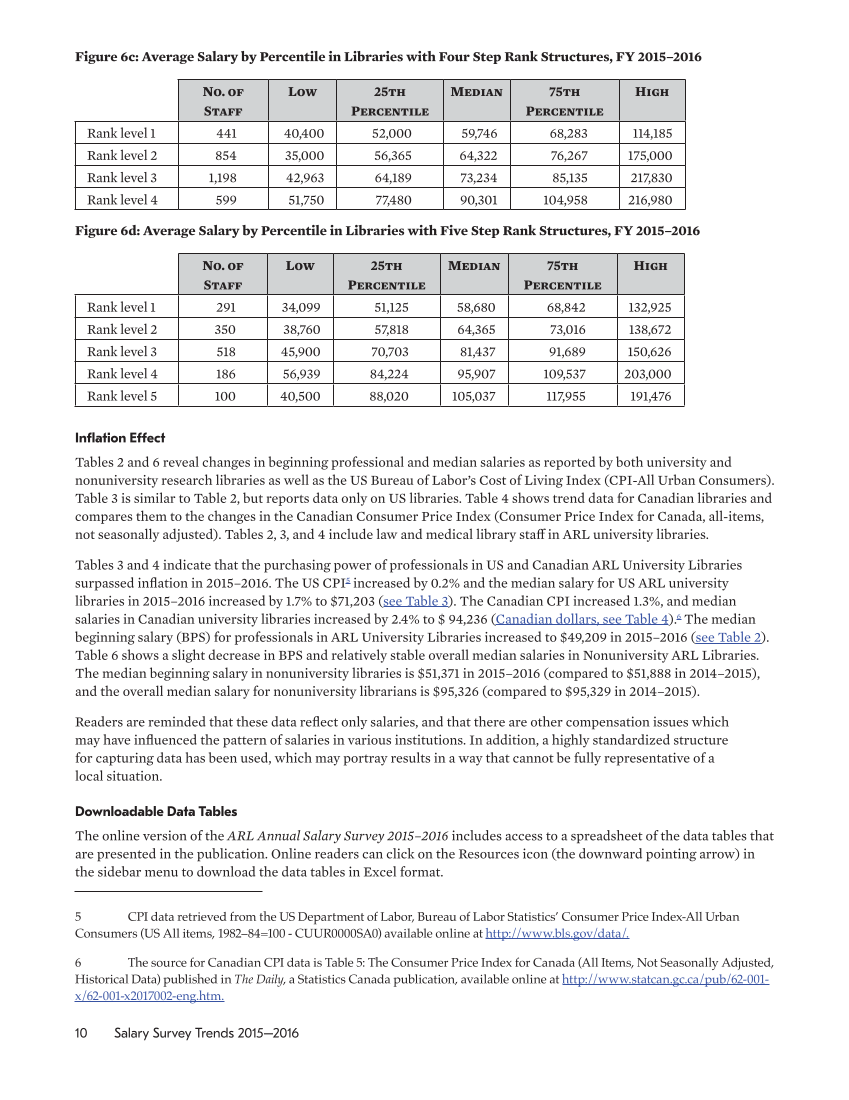
10 Salary Survey Trends 2015–2016 Figure 6c: Average Salary by Percentile in Libraries with Four Step Rank Structures, FY 2015–2016 No. of Staff Low 25th Percentile Median 75th Percentile High Rank level 1 441 40,400 52,000 59,746 68,283 114,185 Rank level 2 854 35,000 56,365 64,322 76,267 175,000 Rank level 3 1,198 42,963 64,189 73,234 85,135 217,830 Rank level 4 599 51,750 77,480 90,301 104,958 216,980 Figure 6d: Average Salary by Percentile in Libraries with Five Step Rank Structures, FY 2015–2016 No. of Staff Low 25th Percentile Median 75th Percentile High Rank level 1 291 34,099 51,125 58,680 68,842 132,925 Rank level 2 350 38,760 57,818 64,365 73,016 138,672 Rank level 3 518 45,900 70,703 81,437 91,689 150,626 Rank level 4 186 56,939 84,224 95,907 109,537 203,000 Rank level 5 100 40,500 88,020 105,037 117,955 191,476 Inflation Effect Tables 2 and 6 reveal changes in beginning professional and median salaries as reported by both university and nonuniversity research libraries as well as the US Bureau of Labor’s Cost of Living Index (CPI-All Urban Consumers). Table 3 is similar to Table 2, but reports data only on US libraries. Table 4 shows trend data for Canadian libraries and compares them to the changes in the Canadian Consumer Price Index (Consumer Price Index for Canada, all-items, not seasonally adjusted). Tables 2, 3, and 4 include law and medical library staff in ARL university libraries. Tables 3 and 4 indicate that the purchasing power of professionals in US and Canadian ARL University Libraries surpassed inflation in 2015–2016. The US CPI5 increased by 0.2% and the median salary for US ARL university libraries in 2015–2016 increased by 1.7% to $71,203 (see Table 3). The Canadian CPI increased 1.3%, and median salaries in Canadian university libraries increased by 2.4% to $94,236 (Canadian dollars, see Table 4).6 The median beginning salary (BPS) for professionals in ARL University Libraries increased to $49,209 in 2015–2016 (see Table 2). Table 6 shows a slight decrease in BPS and relatively stable overall median salaries in Nonuniversity ARL Libraries. The median beginning salary in nonuniversity libraries is $51,371 in 2015–2016 (compared to $51,888 in 2014–2015), and the overall median salary for nonuniversity librarians is $95,326 (compared to $95,329 in 2014–2015). Readers are reminded that these data reflect only salaries, and that there are other compensation issues which may have influenced the pattern of salaries in various institutions. In addition, a highly standardized structure for capturing data has been used, which may portray results in a way that cannot be fully representative of a local situation. Downloadable Data Tables The online version of the ARL Annual Salary Survey 2015–2016 includes access to a spreadsheet of the data tables that are presented in the publication. Online readers can click on the Resources icon (the downward pointing arrow) in the sidebar menu to download the data tables in Excel format. 5 CPI data retrieved from the US Department of Labor, Bureau of Labor Statistics’ Consumer Price Index-All Urban Consumers (US All items, 1982–84=100 -CUUR0000SA0) available online at http://www.bls.gov/data/. 6 The source for Canadian CPI data is Table 5: The Consumer Price Index for Canada (All Items, Not Seasonally Adjusted, Historical Data) published in The Daily, a Statistics Canada publication, available online at http://www.statcan.gc.ca/pub/62-001- x/62-001-x2017002-eng.htm.
Help


