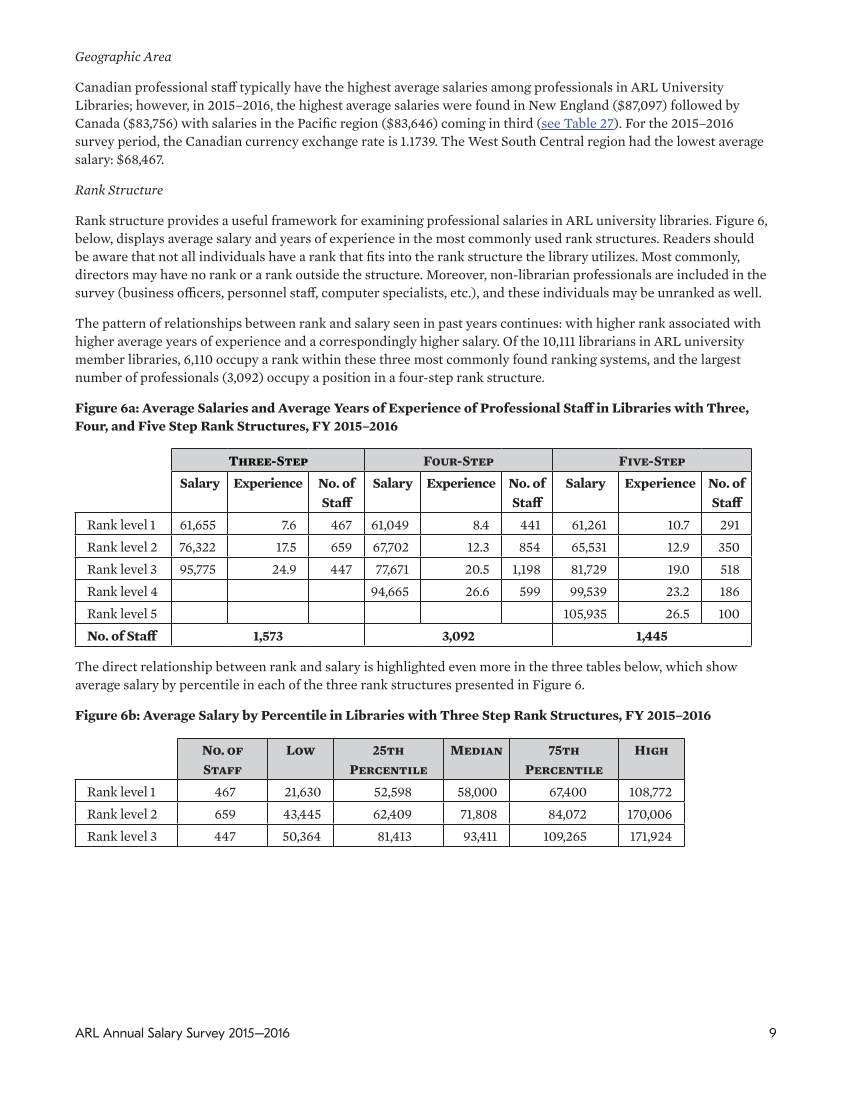
9 ARL Annual Salary Survey 2015–2016 Geographic Area Canadian professional staff typically have the highest average salaries among professionals in ARL University Libraries however, in 2015–2016, the highest average salaries were found in New England ($87,097) followed by Canada ($83,756) with salaries in the Pacific region ($83,646) coming in third (see Table 27). For the 2015–2016 survey period, the Canadian currency exchange rate is 1.1739. The West South Central region had the lowest average salary: $68,467. Rank Structure Rank structure provides a useful framework for examining professional salaries in ARL university libraries. Figure 6, below, displays average salary and years of experience in the most commonly used rank structures. Readers should be aware that not all individuals have a rank that fits into the rank structure the library utilizes. Most commonly, directors may have no rank or a rank outside the structure. Moreover, non-librarian professionals are included in the survey (business officers, personnel staff, computer specialists, etc.), and these individuals may be unranked as well. The pattern of relationships between rank and salary seen in past years continues: with higher rank associated with higher average years of experience and a correspondingly higher salary. Of the 10,111 librarians in ARL university member libraries, 6,110 occupy a rank within these three most commonly found ranking systems, and the largest number of professionals (3,092) occupy a position in a four-step rank structure. Figure 6a: Average Salaries and Average Years of Experience of Professional Staff in Libraries with Three, Four, and Five Step Rank Structures, FY 2015–2016 Three-Step Four-Step Five-Step Salary Experience No. of Staff Salary Experience No. of Staff Salary Experience No. of Staff Rank level 1 61,655 7.6 467 61,049 8.4 441 61,261 10.7 291 Rank level 2 76,322 17.5 659 67,702 12.3 854 65,531 12.9 350 Rank level 3 95,775 24.9 447 77,671 20.5 1,198 81,729 19.0 518 Rank level 4 94,665 26.6 599 99,539 23.2 186 Rank level 5 105,935 26.5 100 No. of Staff 1,573 3,092 1,445 The direct relationship between rank and salary is highlighted even more in the three tables below, which show average salary by percentile in each of the three rank structures presented in Figure 6. Figure 6b: Average Salary by Percentile in Libraries with Three Step Rank Structures, FY 2015–2016 No. of Staff Low 25th Percentile Median 75th Percentile High Rank level 1 467 21,630 52,598 58,000 67,400 108,772 Rank level 2 659 43,445 62,409 71,808 84,072 170,006 Rank level 3 447 50,364 81,413 93,411 109,265 171,924
Help


