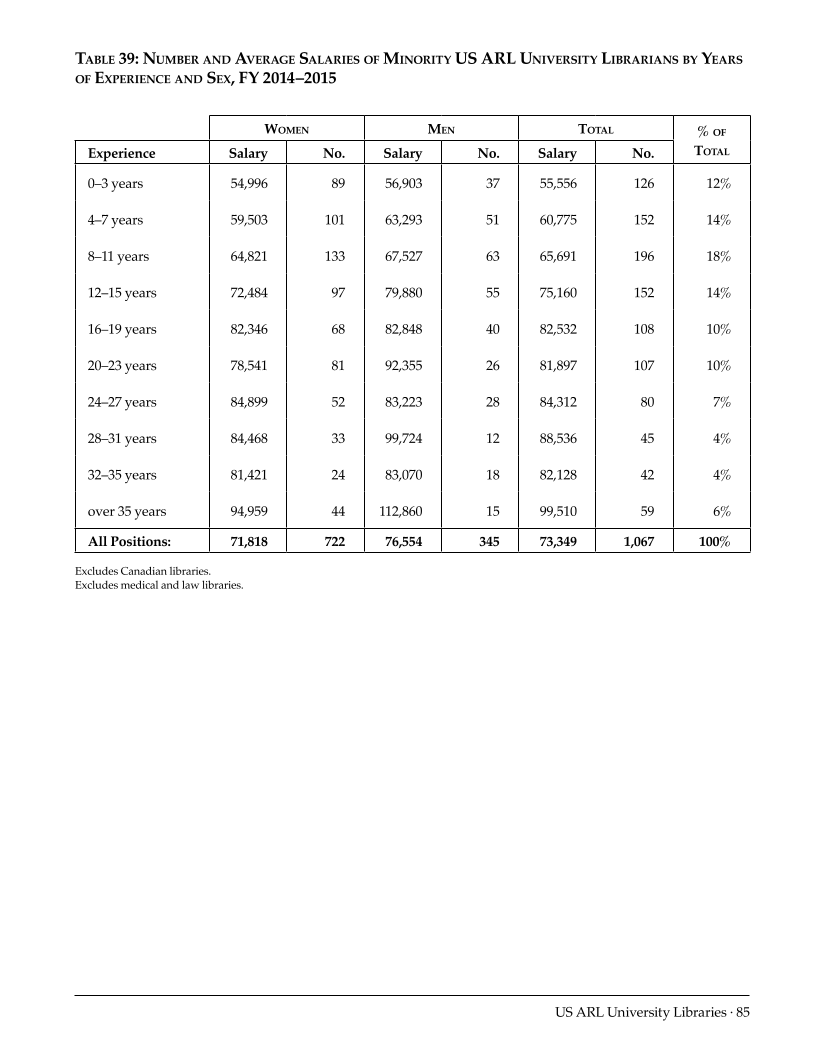
US ARL University Libraries · 85 Table 39: Number and Average Salaries of Minority US ARL University Librarians by Years of Experience and Sex, FY 2014–2015 Women Men Total %of Total Experience Salary No. Salary No. Salary No. 0–3 years 54,996 89 56,903 37 55,556 126 12% 4–7 years 59,503 101 63,293 51 60,775 152 14% 8–11 years 64,821 133 67,527 63 65,691 196 18% 12–15 years 72,484 97 79,880 55 75,160 152 14% 16–19 years 82,346 68 82,848 40 82,532 108 10% 20–23 years 78,541 81 92,355 26 81,897 107 10% 24–27 years 84,899 52 83,223 28 84,312 80 7% 28–31 years 84,468 33 99,724 12 88,536 45 4% 32–35 years 81,421 24 83,070 18 82,128 42 4% over 35 years 94,959 44 112,860 15 99,510 59 6% All Positions: 71,818 722 76,554 345 73,349 1,067 100% Excludes Canadian libraries. Excludes medical and law libraries.
Help


