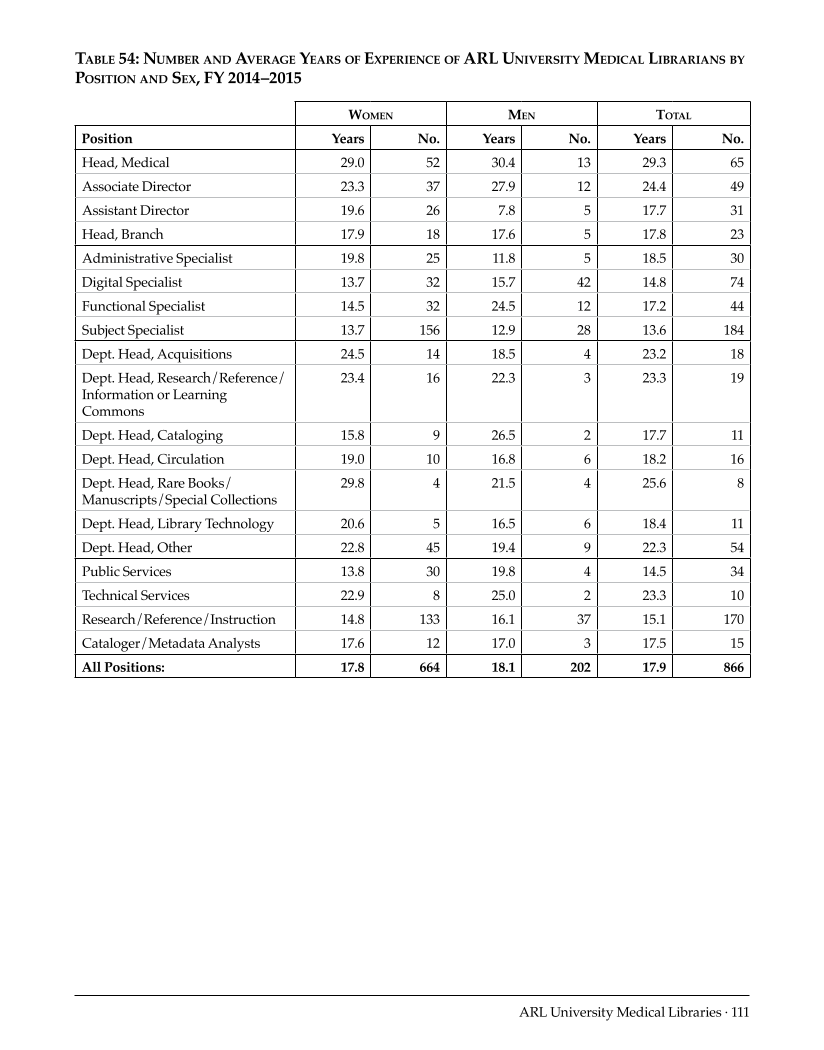
ARL University Medical Libraries · 111 Table 54: Number and Average Years of Experience of ARL University Medical Librarians by Position and Sex, FY 2014–2015 Women Men Total Position Years No. Years No. Years No. Head, Medical 29.0 52 30.4 13 29.3 65 Associate Director 23.3 37 27.9 12 24.4 49 Assistant Director 19.6 26 7.8 5 17.7 31 Head, Branch 17.9 18 17.6 5 17.8 23 Administrative Specialist 19.8 25 11.8 5 18.5 30 Digital Specialist 13.7 32 15.7 42 14.8 74 Functional Specialist 14.5 32 24.5 12 17.2 44 Subject Specialist 13.7 156 12.9 28 13.6 184 Dept. Head, Acquisitions 24.5 14 18.5 4 23.2 18 Dept. Head, Research/Reference/ Information or Learning Commons 23.4 16 22.3 3 23.3 19 Dept. Head, Cataloging 15.8 9 26.5 2 17.7 11 Dept. Head, Circulation 19.0 10 16.8 6 18.2 16 Dept. Head, Rare Books/ Manuscripts/Special Collections 29.8 4 21.5 4 25.6 8 Dept. Head, Library Technology 20.6 5 16.5 6 18.4 11 Dept. Head, Other 22.8 45 19.4 9 22.3 54 Public Services 13.8 30 19.8 4 14.5 34 Technical Services 22.9 8 25.0 2 23.3 10 Research/Reference/Instruction 14.8 133 16.1 37 15.1 170 Cataloger/Metadata Analysts 17.6 12 17.0 3 17.5 15 All Positions: 17.8 664 18.1 202 17.9 866
Help


