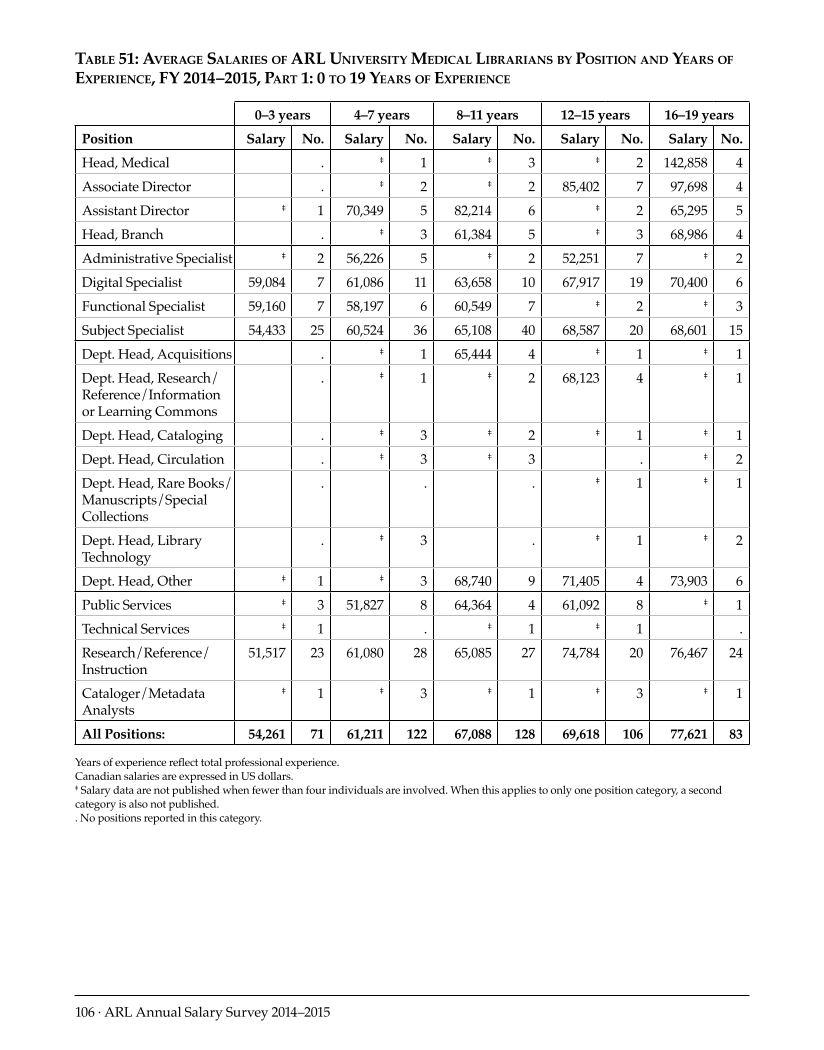
106 · ARL Annual Salary Survey 2014–2015 Table 51: Average Salaries of ARL University Medical Librarians by Position and Years of Experience, FY 2014–2015, Part 1: 0 to 19 Years of Experience 0–3 years 4–7 years 8–11 years 12–15 years 16–19 years Position Salary No. Salary No. Salary No. Salary No. Salary No. Head, Medical .‡ 1 ‡ 3 ‡ 2 142,858 4 Associate Director .‡ 2 ‡ 2 85,402 7 97,698 4 Assistant Director ‡ 1 70,349 5 82,214 6 ‡ 2 65,295 5 Head, Branch .‡ 3 61,384 5 ‡ 3 68,986 4 Administrative Specialist ‡ 2 56,226 5 ‡ 2 52,251 7 ‡ 2 Digital Specialist 59,084 7 61,086 11 63,658 10 67,917 19 70,400 6 Functional Specialist 59,160 7 58,197 6 60,549 7 ‡ 2 ‡ 3 Subject Specialist 54,433 25 60,524 36 65,108 40 68,587 20 68,601 15 Dept. Head, Acquisitions .‡ 1 65,444 4 ‡ 1 ‡ 1 Dept. Head, Research/ Reference/Information or Learning Commons .‡ 1 ‡ 2 68,123 4 ‡ 1 Dept. Head, Cataloging .‡ 3 ‡ 2 ‡ 1 ‡ 1 Dept. Head, Circulation .‡ 3 ‡ 3 .‡ 2 Dept. Head, Rare Books/ Manuscripts/Special Collections ...‡ 1 ‡ 1 Dept. Head, Library Technology .‡ 3 .‡ 1 ‡ 2 Dept. Head, Other ‡ 1 ‡ 3 68,740 9 71,405 4 73,903 6 Public Services ‡ 3 51,827 8 64,364 4 61,092 8 ‡ 1 Technical Services ‡ 1 .‡ 1 ‡ 1 .Research/Reference/ Instruction 51,517 23 61,080 28 65,085 27 74,784 20 76,467 24 Cataloger/Metadata Analysts ‡ 1 ‡ 3 ‡ 1 ‡ 3 ‡ 1 All Positions: 54,261 71 61,211 122 67,088 128 69,618 106 77,621 83 Years of experience reflect total professional experience. Canadian salaries are expressed in US dollars. ‡ Salary data are not published when fewer than four individuals are involved. When this applies to only one position category, a second category is also not published. .No positions reported in this category.
Help


