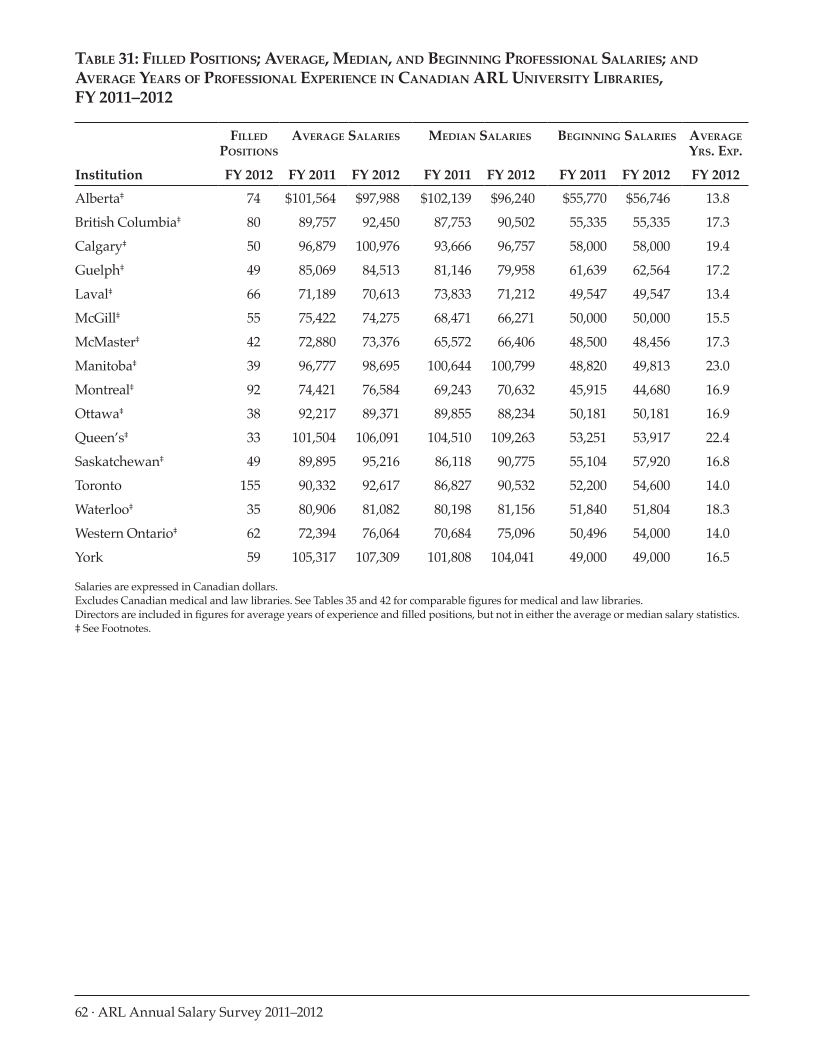
62 · ARL Annual Salary Survey 2011–2012 Table 31: Filled Positions Average, Median, and Beginning Professional Salaries and Average Years of Professional Experience in Canadian ARL University Libraries, FY 2011–2012 Filled Positions Average Salaries Median Salaries Beginning Salaries Average Yrs. Exp. Institution FY 2012 FY 2011 FY 2012 FY 2011 FY 2012 FY 2011 FY 2012 FY 2012 Alberta‡ 74 $101,564 $97,988 $102,139 $96,240 $55,770 $56,746 13.8 British Columbia‡ 80 89,757 92,450 87,753 90,502 55,335 55,335 17.3 Calgary‡ 50 96,879 100,976 93,666 96,757 58,000 58,000 19.4 Guelph‡ 49 85,069 84,513 81,146 79,958 61,639 62,564 17.2 Laval‡ 66 71,189 70,613 73,833 71,212 49,547 49,547 13.4 McGill‡ 55 75,422 74,275 68,471 66,271 50,000 50,000 15.5 McMaster‡ 42 72,880 73,376 65,572 66,406 48,500 48,456 17.3 Manitoba‡ 39 96,777 98,695 100,644 100,799 48,820 49,813 23.0 Montreal‡ 92 74,421 76,584 69,243 70,632 45,915 44,680 16.9 Ottawa‡ 38 92,217 89,371 89,855 88,234 50,181 50,181 16.9 Queen’s‡ 33 101,504 106,091 104,510 109,263 53,251 53,917 22.4 Saskatchewan‡ 49 89,895 95,216 86,118 90,775 55,104 57,920 16.8 Toronto 155 90,332 92,617 86,827 90,532 52,200 54,600 14.0 Waterloo‡ 35 80,906 81,082 80,198 81,156 51,840 51,804 18.3 Western Ontario‡ 62 72,394 76,064 70,684 75,096 50,496 54,000 14.0 York 59 105,317 107,309 101,808 104,041 49,000 49,000 16.5 Salaries are expressed in Canadian dollars. Excludes Canadian medical and law libraries. See Tables 35 and 42 for comparable figures for medical and law libraries. Directors are included in figures for average years of experience and filled positions, but not in either the average or median salary statistics. ‡ See Footnotes.
Help


