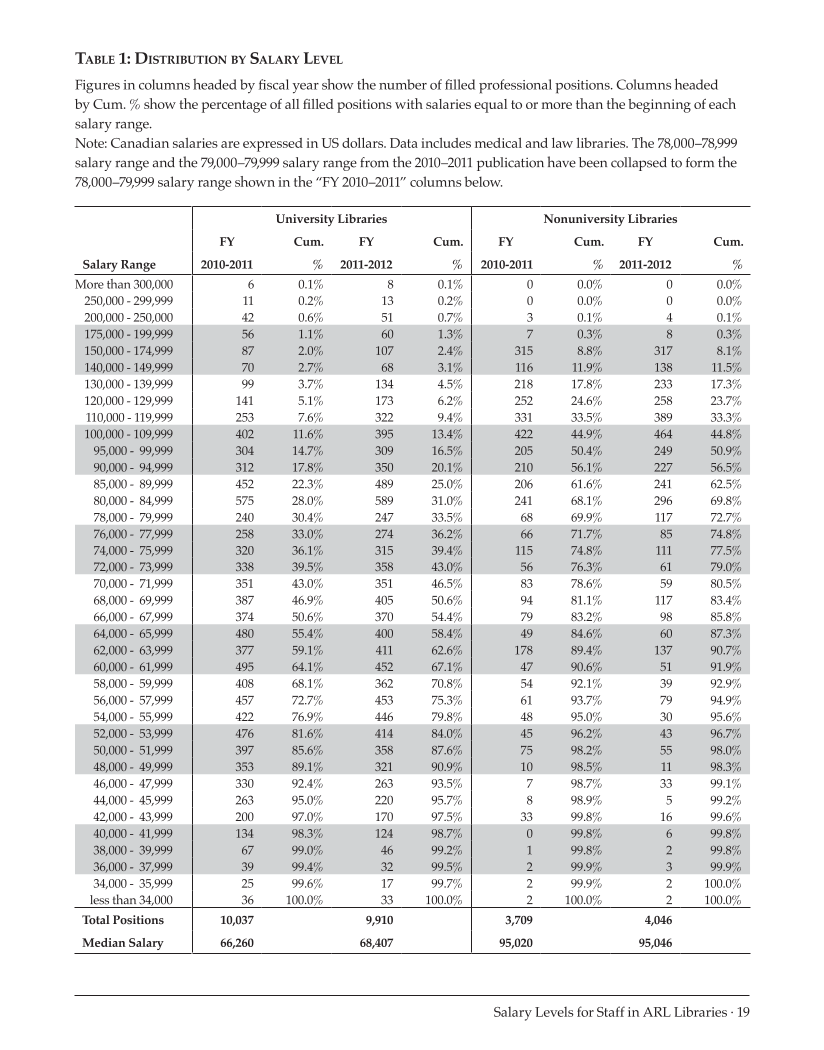
Salary Levels for Staff in ARL Libraries · 19 Table 1: Distribution by Salary Level Figures in columns headed by fiscal year show the number of filled professional positions. Columns headed by Cum. %show the percentage of all filled positions with salaries equal to or more than the beginning of each salary range. Note: Canadian salaries are expressed in US dollars. Data includes medical and law libraries. The 78,000–78,999 salary range and the 79,000–79,999 salary range from the 2010–2011 publication have been collapsed to form the 78,000–79,999 salary range shown in the “FY 2010–2011” columns below. University Libraries Nonuniversity Libraries FY Cum. FY Cum. FY Cum. FY Cum. Salary Range 2010-2011 %2011-2012 %2010-2011 %2011-2012 %More than 300,000 6 0.1% 8 0.1% 0 0.0% 0 0.0% 250,000 -299,999 11 0.2% 13 0.2% 0 0.0% 0 0.0% 200,000 -250,000 42 0.6% 51 0.7% 3 0.1% 4 0.1% 175,000 -199,999 56 1.1% 60 1.3% 7 0.3% 8 0.3% 150,000 -174,999 87 2.0% 107 2.4% 315 8.8% 317 8.1% 140,000 -149,999 70 2.7% 68 3.1% 116 11.9% 138 11.5% 130,000 -139,999 99 3.7% 134 4.5% 218 17.8% 233 17.3% 120,000 -129,999 141 5.1% 173 6.2% 252 24.6% 258 23.7% 110,000 -119,999 253 7.6% 322 9.4% 331 33.5% 389 33.3% 100,000 -109,999 402 11.6% 395 13.4% 422 44.9% 464 44.8% 95,000 -99,999 304 14.7% 309 16.5% 205 50.4% 249 50.9% 90,000 -94,999 312 17.8% 350 20.1% 210 56.1% 227 56.5% 85,000 -89,999 452 22.3% 489 25.0% 206 61.6% 241 62.5% 80,000 -84,999 575 28.0% 589 31.0% 241 68.1% 296 69.8% 78,000 -79,999 240 30.4% 247 33.5% 68 69.9% 117 72.7% 76,000 -77,999 258 33.0% 274 36.2% 66 71.7% 85 74.8% 74,000 -75,999 320 36.1% 315 39.4% 115 74.8% 111 77.5% 72,000 -73,999 338 39.5% 358 43.0% 56 76.3% 61 79.0% 70,000 -71,999 351 43.0% 351 46.5% 83 78.6% 59 80.5% 68,000 -69,999 387 46.9% 405 50.6% 94 81.1% 117 83.4% 66,000 -67,999 374 50.6% 370 54.4% 79 83.2% 98 85.8% 64,000 -65,999 480 55.4% 400 58.4% 49 84.6% 60 87.3% 62,000 -63,999 377 59.1% 411 62.6% 178 89.4% 137 90.7% 60,000 -61,999 495 64.1% 452 67.1% 47 90.6% 51 91.9% 58,000 -59,999 408 68.1% 362 70.8% 54 92.1% 39 92.9% 56,000 -57,999 457 72.7% 453 75.3% 61 93.7% 79 94.9% 54,000 -55,999 422 76.9% 446 79.8% 48 95.0% 30 95.6% 52,000 -53,999 476 81.6% 414 84.0% 45 96.2% 43 96.7% 50,000 -51,999 397 85.6% 358 87.6% 75 98.2% 55 98.0% 48,000 -49,999 353 89.1% 321 90.9% 10 98.5% 11 98.3% 46,000 -47,999 330 92.4% 263 93.5% 7 98.7% 33 99.1% 44,000 -45,999 263 95.0% 220 95.7% 8 98.9% 5 99.2% 42,000 -43,999 200 97.0% 170 97.5% 33 99.8% 16 99.6% 40,000 -41,999 134 98.3% 124 98.7% 0 99.8% 6 99.8% 38,000 -39,999 67 99.0% 46 99.2% 1 99.8% 2 99.8% 36,000 -37,999 39 99.4% 32 99.5% 2 99.9% 3 99.9% 34,000 -35,999 25 99.6% 17 99.7% 2 99.9% 2 100.0% less than 34,000 36 100.0% 33 100.0% 2 100.0% 2 100.0% Total Positions 10,037 9,910 3,709 4,046 Median Salary 66,260 68,407 95,020 95,046
Help


