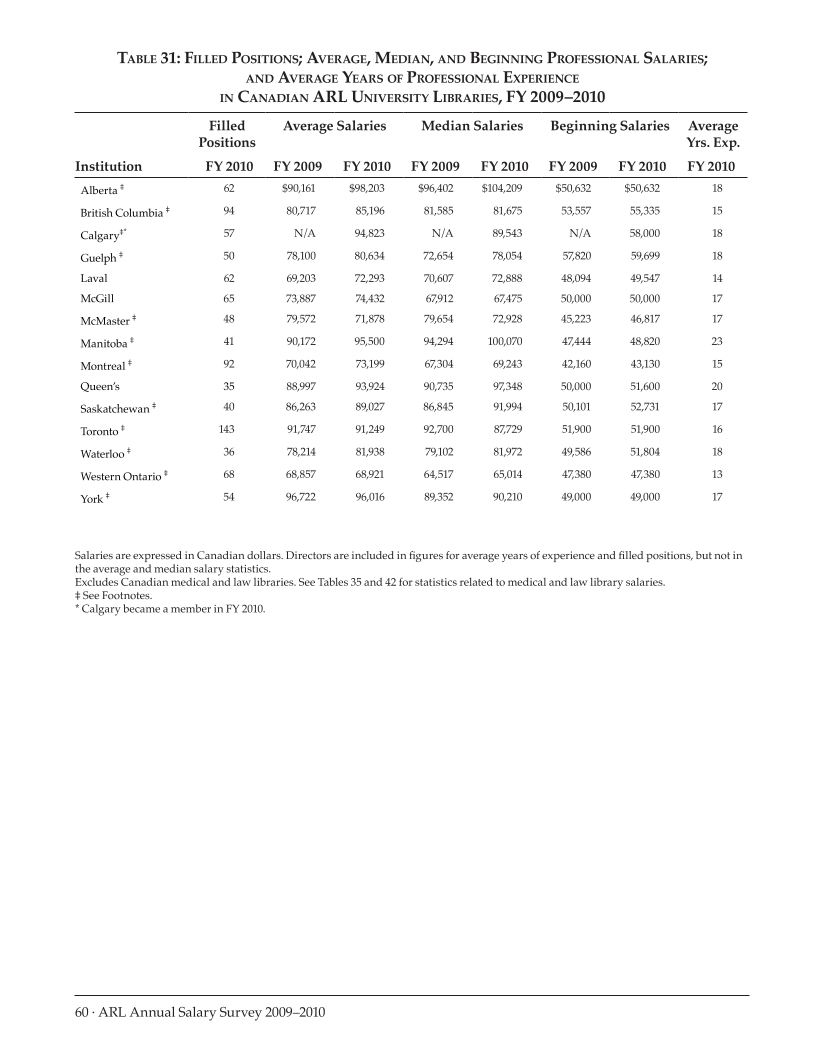
60 · ARL Annual Salary Survey 2009–2010 Table 31: Filled Positions Average, Median, and Beginning Professional Salaries and Average Years of Professional Experience in Canadian ARL University Libraries, FY 2009–2010 Salaries are expressed in Canadian dollars. Directors are included in figures for average years of experience and filled positions, but not in the average and median salary statistics. Excludes Canadian medical and law libraries. See Tables 35 and 42 for statistics related to medical and law library salaries. ‡ See Footnotes. * Calgary became a member in FY 2010. Filled Positions Average Salaries Median Salaries Beginning Salaries Average Yrs. Exp. Institution FY 2010 FY 2009 FY 2010 FY 2009 FY 2010 FY 2009 FY 2010 FY 2010 Alberta ‡ 62 $90,161 $98,203 $96,402 $104,209 $50,632 $50,632 18 British Columbia ‡ 94 80,717 85,196 81,585 81,675 53,557 55,335 15 Calgary‡* 57 N/A 94,823 N/A 89,543 N/A 58,000 18 Guelph ‡ 50 78,100 80,634 72,654 78,054 57,820 59,699 18 Laval 62 69,203 72,293 70,607 72,888 48,094 49,547 14 McGill 65 73,887 74,432 67,912 67,475 50,000 50,000 17 McMaster ‡ 48 79,572 71,878 79,654 72,928 45,223 46,817 17 Manitoba ‡ 41 90,172 95,500 94,294 100,070 47,444 48,820 23 Montreal ‡ 92 70,042 73,199 67,304 69,243 42,160 43,130 15 Queen’s 35 88,997 93,924 90,735 97,348 50,000 51,600 20 Saskatchewan ‡ 40 86,263 89,027 86,845 91,994 50,101 52,731 17 Toronto ‡ 143 91,747 91,249 92,700 87,729 51,900 51,900 16 Waterloo ‡ 36 78,214 81,938 79,102 81,972 49,586 51,804 18 Western Ontario ‡ 68 68,857 68,921 64,517 65,014 47,380 47,380 13 York ‡ 54 96,722 96,016 89,352 90,210 49,000 49,000 17
Help


