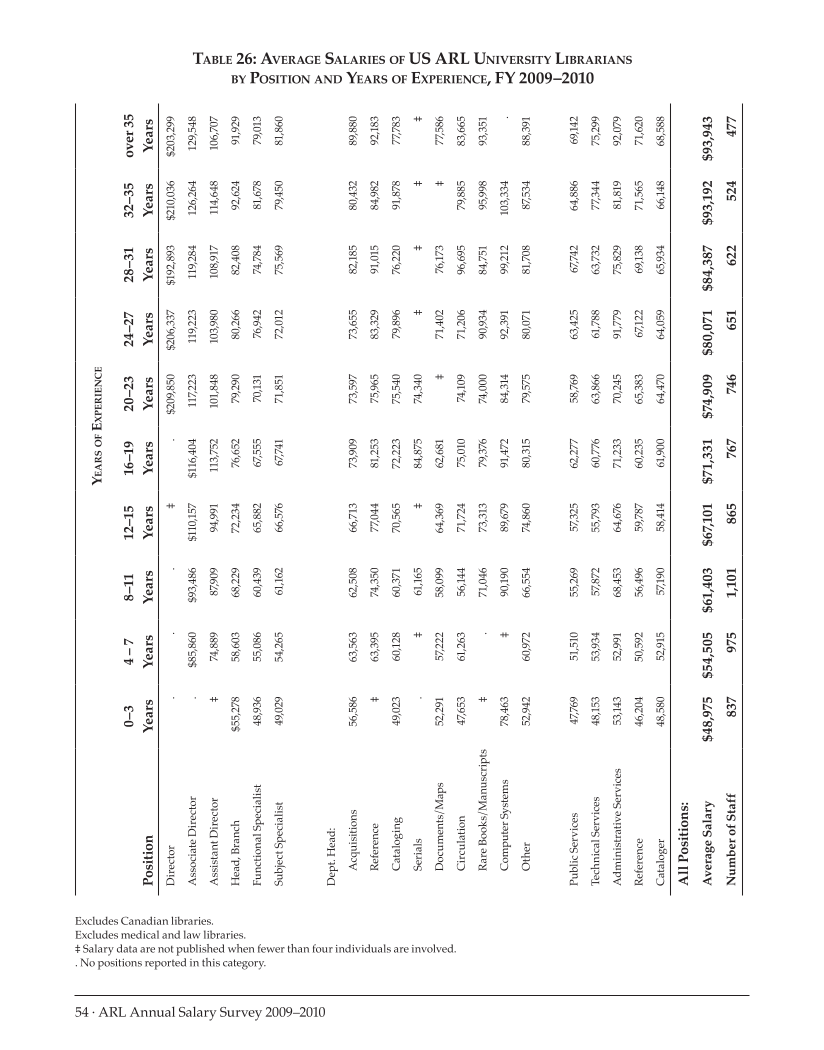
YearsofExperience Position 0–3 Years 4 – 7 Years 8–11 Years 12–15 Years 16–19 Years 20–23 Years 24–27 Years 28–31 Years 32–35 Years over 35 Years Director . . . ‡ . $209,850 $206,337 $192,893 $210,036 $203,299 Associate Director . $85,860 $93,486 $110,157 $116,404 117,223 119,223 119,284 126,264 129,548 Assistant Director ‡ 74,889 87,909 94,991 113,752 101,848 103,980 108,917 114,648 106,707 Head, Branch $55,278 58,603 68,229 72,234 76,652 79,290 80,266 82,408 92,624 91,929 Functional Specialist 48,936 55,086 60,439 65,882 67,555 70,131 76,942 74,784 81,678 79,013 Subject Specialist 49,029 54,265 61,162 66,576 67,741 71,851 72,012 75,569 79,450 81,860 Dept. Head: Acquisitions 56,586 63,563 62,508 66,713 73,909 73,597 73,655 82,185 80,432 89,880 Reference ‡ 63,395 74,350 77,044 81,253 75,965 83,329 91,015 84,982 92,183 Cataloging 49,023 60,128 60,371 70,565 72,223 75,540 79,896 76,220 91,878 77,783 Serials . ‡ 61,165 ‡ 84,875 74,340 ‡ ‡ ‡ ‡ Documents/Maps 52,291 57,222 58,099 64,369 62,681 ‡ 71,402 76,173 ‡ 77,586 Circulation 47,653 61,263 56,144 71,724 75,010 74,109 71,206 96,695 79,885 83,665 Rare Books/Manuscripts ‡ . 71,046 73,313 79,376 74,000 90,934 84,751 95,998 93,351 Computer Systems 78,463 ‡ 90,190 89,679 91,472 84,314 92,391 99,212 103,334 . Other 52,942 60,972 66,554 74,860 80,315 79,575 80,071 81,708 87,534 88,391 Public Services 47,769 51,510 55,269 57,325 62,277 58,769 63,425 67,742 64,886 69,142 Technical Services 48,153 53,934 57,872 55,793 60,776 63,866 61,788 63,732 77,344 75,299 Administrative Services 53,143 52,991 68,453 64,676 71,233 70,245 91,779 75,829 81,819 92,079 Reference 46,204 50,592 56,496 59,787 60,235 65,383 67,122 69,138 71,565 71,620 Cataloger 48,580 52,915 57,190 58,414 61,900 64,470 64,059 65,934 66,148 68,588 All Positions: Average Salary $48,975 $54,505 $61,403 $67,101 $71,331 $74,909 $80,071 $84,387 $93,192 $93,943 Number of Staff 837 975 1,101 865 767 746 651 622 524 477 54 · ARL Annual Salary Survey 2009–2010 Table 26: Average Salaries of US ARL University Librarians by Position and Years of Experience, FY 2009–2010 Excludes Canadian libraries. Excludes medical and law libraries. ‡ Salary data are not published when fewer than four individuals are involved. . No positions reported in this category.
Help


