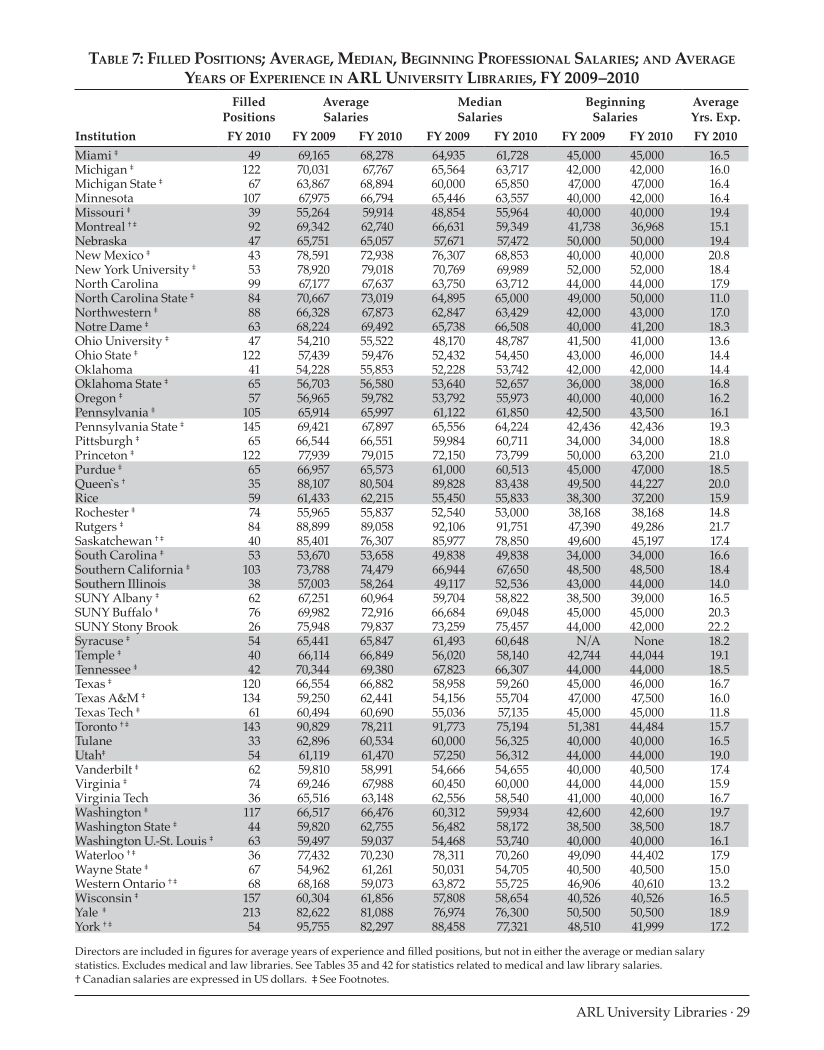
ARL University Libraries · 29 Table 7: Filled Positions Average, Median, Beginning Professional Salaries and Average Years of Experience in ARL University Libraries, FY 2009–2010 Filled Positions Average Salaries Median Salaries Beginning Salaries Average Yrs. Exp. Institution FY 2010 FY 2009 FY 2010 FY 2009 FY 2010 FY 2009 FY 2010 FY 2010 Miami ‡ 49 69,165 68,278 64,935 61,728 45,000 45,000 16.5 Michigan ‡ 122 70,031 67,767 65,564 63,717 42,000 42,000 16.0 Michigan State ‡ 67 63,867 68,894 60,000 65,850 47,000 47,000 16.4 Minnesota 107 67,975 66,794 65,446 63,557 40,000 42,000 16.4 Missouri ‡ 39 55,264 59,914 48,854 55,964 40,000 40,000 19.4 Montreal † ‡ 92 69,342 62,740 66,631 59,349 41,738 36,968 15.1 Nebraska 47 65,751 65,057 57,671 57,472 50,000 50,000 19.4 New Mexico ‡ 43 78,591 72,938 76,307 68,853 40,000 40,000 20.8 New York University ‡ 53 78,920 79,018 70,769 69,989 52,000 52,000 18.4 North Carolina 99 67,177 67,637 63,750 63,712 44,000 44,000 17.9 North Carolina State ‡ 84 70,667 73,019 64,895 65,000 49,000 50,000 11.0 Northwestern ‡ 88 66,328 67,873 62,847 63,429 42,000 43,000 17.0 Notre Dame ‡ 63 68,224 69,492 65,738 66,508 40,000 41,200 18.3 Ohio University ‡ 47 54,210 55,522 48,170 48,787 41,500 41,000 13.6 Ohio State ‡ 122 57,439 59,476 52,432 54,450 43,000 46,000 14.4 Oklahoma 41 54,228 55,853 52,228 53,742 42,000 42,000 14.4 Oklahoma State ‡ 65 56,703 56,580 53,640 52,657 36,000 38,000 16.8 Oregon ‡ 57 56,965 59,782 53,792 55,973 40,000 40,000 16.2 Pennsylvania ‡ 105 65,914 65,997 61,122 61,850 42,500 43,500 16.1 Pennsylvania State ‡ 145 69,421 67,897 65,556 64,224 42,436 42,436 19.3 Pittsburgh ‡ 65 66,544 66,551 59,984 60,711 34,000 34,000 18.8 Princeton ‡ 122 77,939 79,015 72,150 73,799 50,000 63,200 21.0 Purdue ‡ 65 66,957 65,573 61,000 60,513 45,000 47,000 18.5 Queen`s † 35 88,107 80,504 89,828 83,438 49,500 44,227 20.0 Rice 59 61,433 62,215 55,450 55,833 38,300 37,200 15.9 Rochester ‡ 74 55,965 55,837 52,540 53,000 38,168 38,168 14.8 Rutgers ‡ 84 88,899 89,058 92,106 91,751 47,390 49,286 21.7 Saskatchewan † ‡ 40 85,401 76,307 85,977 78,850 49,600 45,197 17.4 South Carolina ‡ 53 53,670 53,658 49,838 49,838 34,000 34,000 16.6 Southern California ‡ 103 73,788 74,479 66,944 67,650 48,500 48,500 18.4 Southern Illinois 38 57,003 58,264 49,117 52,536 43,000 44,000 14.0 SUNY Albany ‡ 62 67,251 60,964 59,704 58,822 38,500 39,000 16.5 SUNY Buffalo ‡ 76 69,982 72,916 66,684 69,048 45,000 45,000 20.3 SUNY Stony Brook 26 75,948 79,837 73,259 75,457 44,000 42,000 22.2 Syracuse ‡ 54 65,441 65,847 61,493 60,648 N/A None 18.2 Temple ‡ 40 66,114 66,849 56,020 58,140 42,744 44,044 19.1 Tennessee ‡ 42 70,344 69,380 67,823 66,307 44,000 44,000 18.5 Texas ‡ 120 66,554 66,882 58,958 59,260 45,000 46,000 16.7 Texas A&M ‡ 134 59,250 62,441 54,156 55,704 47,000 47,500 16.0 Texas Tech ‡ 61 60,494 60,690 55,036 57,135 45,000 45,000 11.8 Toronto † ‡ 143 90,829 78,211 91,773 75,194 51,381 44,484 15.7 Tulane 33 62,896 60,534 60,000 56,325 40,000 40,000 16.5 Utah‡ 54 61,119 61,470 57,250 56,312 44,000 44,000 19.0 Vanderbilt ‡ 62 59,810 58,991 54,666 54,655 40,000 40,500 17.4 Virginia ‡ 74 69,246 67,988 60,450 60,000 44,000 44,000 15.9 Virginia Tech 36 65,516 63,148 62,556 58,540 41,000 40,000 16.7 Washington ‡ 117 66,517 66,476 60,312 59,934 42,600 42,600 19.7 Washington State ‡ 44 59,820 62,755 56,482 58,172 38,500 38,500 18.7 Washington U.-St. Louis ‡ 63 59,497 59,037 54,468 53,740 40,000 40,000 16.1 Waterloo † ‡ 36 77,432 70,230 78,311 70,260 49,090 44,402 17.9 Wayne State ‡ 67 54,962 61,261 50,031 54,705 40,500 40,500 15.0 Western Ontario † ‡ 68 68,168 59,073 63,872 55,725 46,906 40,610 13.2 Wisconsin ‡ 157 60,304 61,856 57,808 58,654 40,526 40,526 16.5 Yale ‡ 213 82,622 81,088 76,974 76,300 50,500 50,500 18.9 York † ‡ 54 95,755 82,297 88,458 77,321 48,510 41,999 17.2 Directors are included in figures for average years of experience and filled positions, but not in either the average or median salary statistics. Excludes medical and law libraries. See Tables 35 and 42 for statistics related to medical and law library salaries. † Canadian salaries are expressed in US dollars. ‡ See Footnotes.
Help


