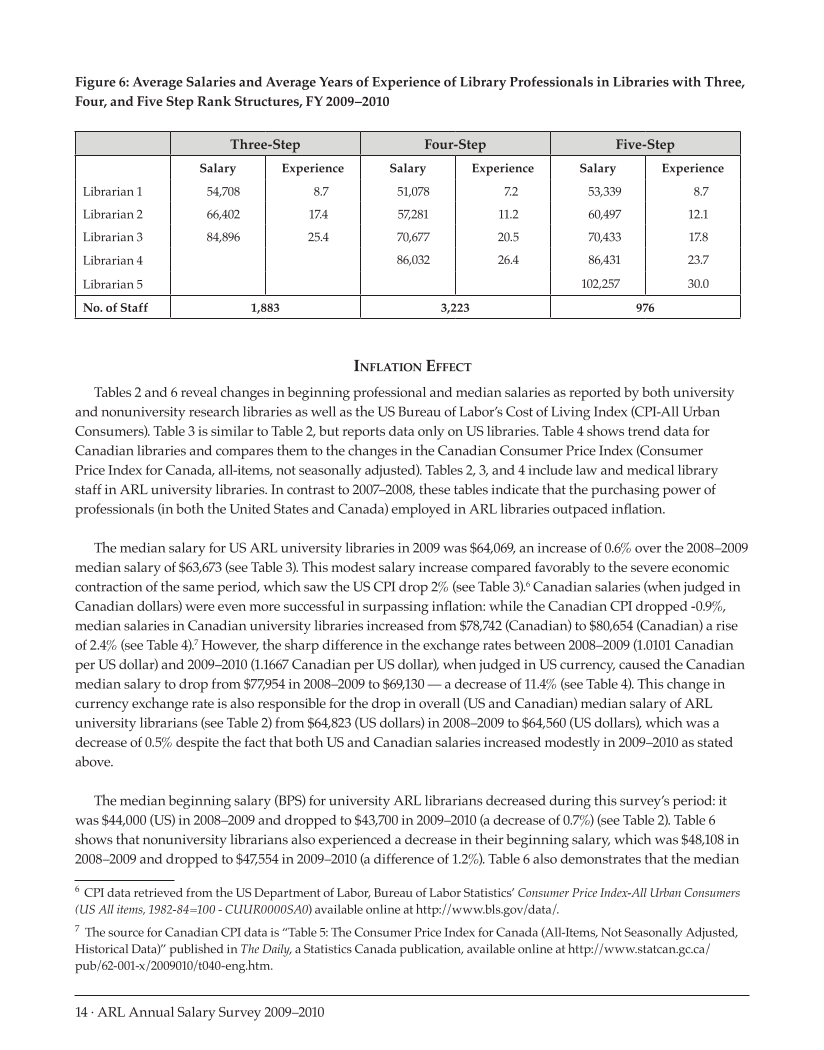
14 · ARL Annual Salary Survey 2009–2010 Figure 6: Average Salaries and Average Years of Experience of Library Professionals in Libraries with Three, Four, and Five Step Rank Structures, FY 2009–2010 Three-Step Four-Step Five-Step Salary Experience Salary Experience Salary Experience Librarian 1 54,708 8.7 51,078 7.2 53,339 8.7 Librarian 2 66,402 17.4 57,281 11.2 60,497 12.1 Librarian 3 84,896 25.4 70,677 20.5 70,433 17.8 Librarian 4 86,032 26.4 86,431 23.7 Librarian 5 102,257 30.0 No. of Staff 1,883 3,223 976 Inflation Effect Tables 2 and 6 reveal changes in beginning professional and median salaries as reported by both university and nonuniversity research libraries as well as the US Bureau of Labor’s Cost of Living Index (CPI-All Urban Consumers). Table 3 is similar to Table 2, but reports data only on US libraries. Table 4 shows trend data for Canadian libraries and compares them to the changes in the Canadian Consumer Price Index (Consumer Price Index for Canada, all-items, not seasonally adjusted). Tables 2, 3, and 4 include law and medical library staff in ARL university libraries. In contrast to 2007–2008, these tables indicate that the purchasing power of professionals (in both the United States and Canada) employed in ARL libraries outpaced inflation. The median salary for US ARL university libraries in 2009 was $64,069, an increase of 0.6% over the 2008–2009 median salary of $63,673 (see Table 3). This modest salary increase compared favorably to the severe economic contraction of the same period, which saw the US CPI drop 2% (see Table 3).6 Canadian salaries (when judged in Canadian dollars) were even more successful in surpassing inflation: while the Canadian CPI dropped -0.9%, median salaries in Canadian university libraries increased from $78,742 (Canadian) to $80,654 (Canadian) a rise of 2.4% (see Table 4).7 However, the sharp difference in the exchange rates between 2008–2009 (1.0101 Canadian per US dollar) and 2009–2010 (1.1667 Canadian per US dollar), when judged in US currency, caused the Canadian median salary to drop from $77,954 in 2008–2009 to $69,130 — a decrease of 11.4% (see Table 4). This change in currency exchange rate is also responsible for the drop in overall (US and Canadian) median salary of ARL university librarians (see Table 2) from $64,823 (US dollars) in 2008–2009 to $64,560 (US dollars), which was a decrease of 0.5% despite the fact that both US and Canadian salaries increased modestly in 2009–2010 as stated above. The median beginning salary (BPS) for university ARL librarians decreased during this survey’s period: it was $44,000 (US) in 2008–2009 and dropped to $43,700 in 2009–2010 (a decrease of 0.7%) (see Table 2). Table 6 shows that nonuniversity librarians also experienced a decrease in their beginning salary, which was $48,108 in 2008–2009 and dropped to $47,554 in 2009–2010 (a difference of 1.2%). Table 6 also demonstrates that the median 6 CPI data retrieved from the US Department of Labor, Bureau of Labor Statistics’ Consumer Price Index-All Urban Consumers (US All items, 1982-84=100 - CUUR0000SA0) available online at http://www.bls.gov/data/. 7 The source for Canadian CPI data is “Table 5: The Consumer Price Index for Canada (All-Items, Not Seasonally Adjusted, Historical Data)” published in The Daily, a Statistics Canada publication, available online at http://www.statcan.gc.ca/ pub/62-001-x/2009010/t040-eng.htm.
Help


