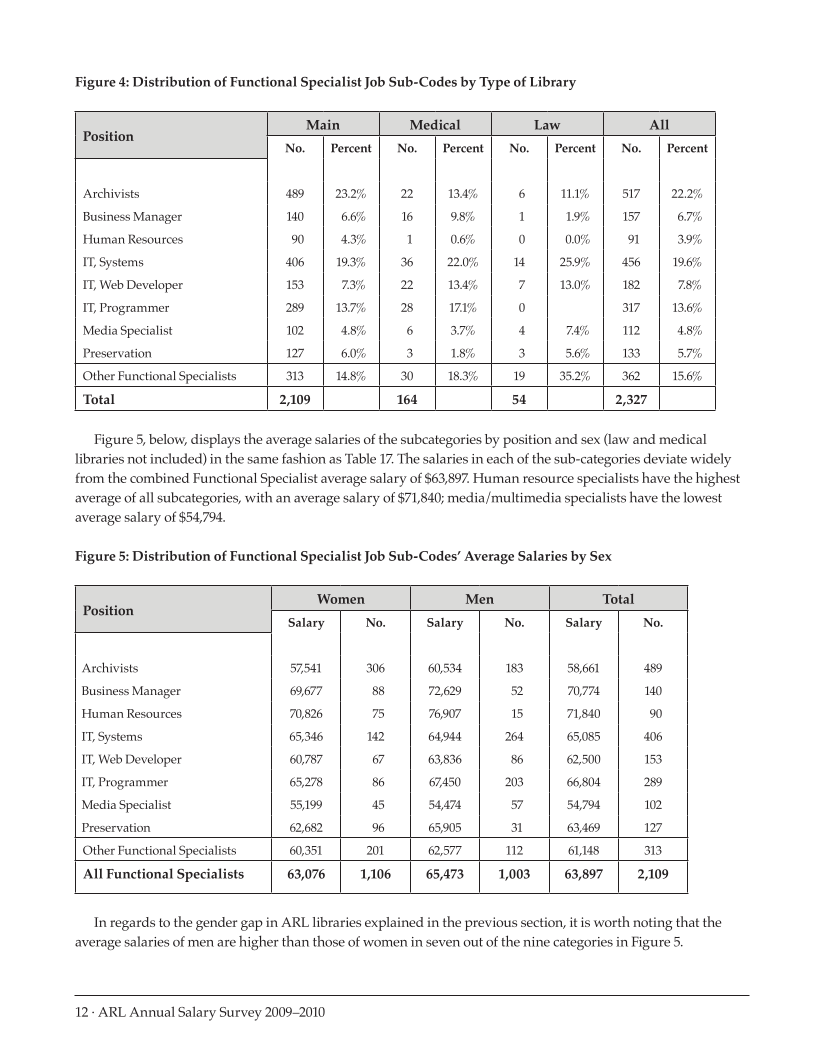
12 · ARL Annual Salary Survey 2009–2010 Figure 4: Distribution of Functional Specialist Job Sub-Codes by Type of Library Position Main Medical Law All No. Percent No. Percent No. Percent No. Percent Archivists 489 23.2% 22 13.4% 6 11.1% 517 22.2% Business Manager 140 6.6% 16 9.8% 1 1.9% 157 6.7% Human Resources 90 4.3% 1 0.6% 0 0.0% 91 3.9% IT, Systems 406 19.3% 36 22.0% 14 25.9% 456 19.6% IT, Web Developer 153 7.3% 22 13.4% 7 13.0% 182 7.8% IT, Programmer 289 13.7% 28 17.1% 0 317 13.6% Media Specialist 102 4.8% 6 3.7% 4 7.4% 112 4.8% Preservation 127 6.0% 3 1.8% 3 5.6% 133 5.7% Other Functional Specialists 313 14.8% 30 18.3% 19 35.2% 362 15.6% Total 2,109 164 54 2,327 Figure 5, below, displays the average salaries of the subcategories by position and sex (law and medical libraries not included) in the same fashion as Table 17. The salaries in each of the sub-categories deviate widely from the combined Functional Specialist average salary of $63,897. Human resource specialists have the highest average of all subcategories, with an average salary of $71,840 media/multimedia specialists have the lowest average salary of $54,794. Figure 5: Distribution of Functional Specialist Job Sub-Codes’ Average Salaries by Sex Position Women Men Total Salary No. Salary No. Salary No. Archivists 57,541 306 60,534 183 58,661 489 Business Manager 69,677 88 72,629 52 70,774 140 Human Resources 70,826 75 76,907 15 71,840 90 IT, Systems 65,346 142 64,944 264 65,085 406 IT, Web Developer 60,787 67 63,836 86 62,500 153 IT, Programmer 65,278 86 67,450 203 66,804 289 Media Specialist 55,199 45 54,474 57 54,794 102 Preservation 62,682 96 65,905 31 63,469 127 Other Functional Specialists 60,351 201 62,577 112 61,148 313 All Functional Specialists 63,076 1,106 65,473 1,003 63,897 2,109 In regards to the gender gap in ARL libraries explained in the previous section, it is worth noting that the average salaries of men are higher than those of women in seven out of the nine categories in Figure 5.
Help


