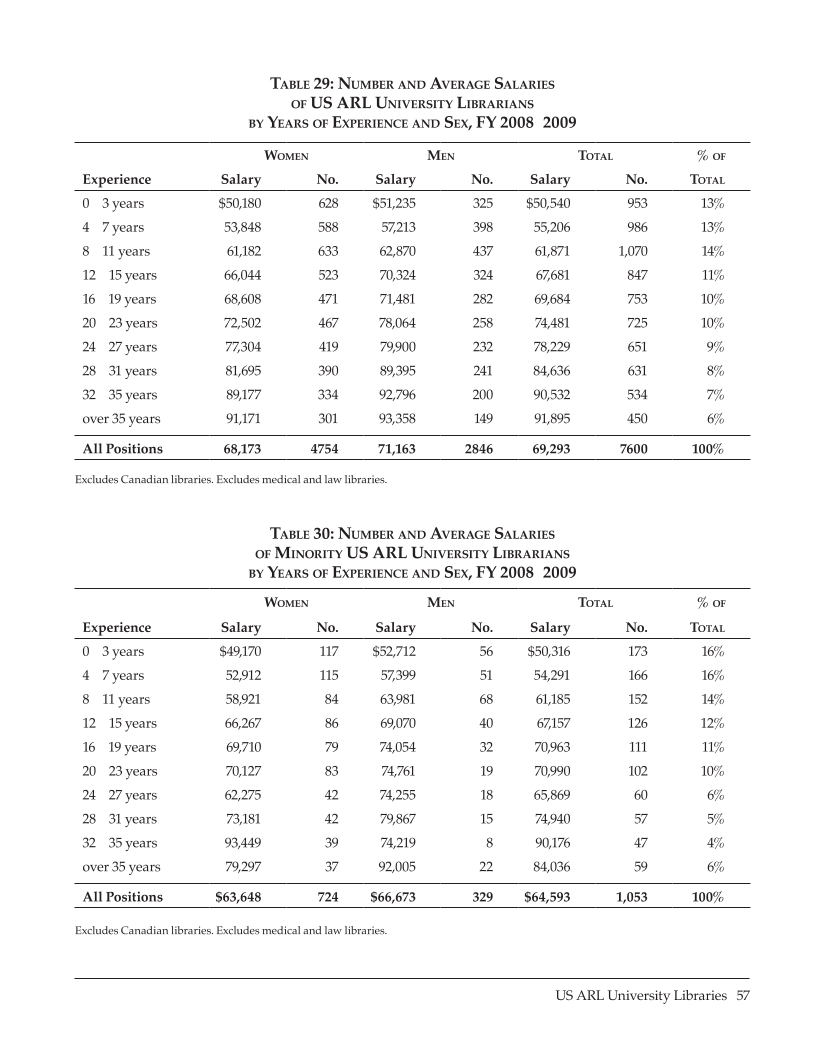
US ARL University Libraries · 57 Table 29: Number and Average Salaries of US ARL University Librarians by Years of Experience and Sex, FY 2008–2009 Table 30: Number and Average Salaries of Minority US ARL University Librarians by Years of Experience and Sex, FY 2008–2009 Women Men Total % of Experience Salary No. Salary No. Salary No. Total 0 – 3 years $50,180 628 $51,235 325 $50,540 953 13% 4 – 7 years 53,848 588 57,213 398 55,206 986 13% 8 – 11 years 61,182 633 62,870 437 61,871 1,070 14% 12 – 15 years 66,044 523 70,324 324 67,681 847 11% 16 – 19 years 68,608 471 71,481 282 69,684 753 10% 20 – 23 years 72,502 467 78,064 258 74,481 725 10% 24 – 27 years 77,304 419 79,900 232 78,229 651 9% 28 – 31 years 81,695 390 89,395 241 84,636 631 8% 32 – 35 years 89,177 334 92,796 200 90,532 534 7% over 35 years 91,171 301 93,358 149 91,895 450 6% All Positions 68,173 4754 71,163 2846 69,293 7600 100% Women Men Total % of Experience Salary No. Salary No. Salary No. Total 0 – 3 years $49,170 117 $52,712 56 $50,316 173 16% 4 – 7 years 52,912 115 57,399 51 54,291 166 16% 8 – 11 years 58,921 84 63,981 68 61,185 152 14% 12 – 15 years 66,267 86 69,070 40 67,157 126 12% 16 – 19 years 69,710 79 74,054 32 70,963 111 11% 20 – 23 years 70,127 83 74,761 19 70,990 102 10% 24 – 27 years 62,275 42 74,255 18 65,869 60 6% 28 – 31 years 73,181 42 79,867 15 74,940 57 5% 32 – 35 years 93,449 39 74,219 8 90,176 47 4% over 35 years 79,297 37 92,005 22 84,036 59 6% All Positions $63,648 724 $66,673 329 $64,593 1,053 100% Excludes Canadian libraries. Excludes medical and law libraries. Excludes Canadian libraries. Excludes medical and law libraries.
Help


