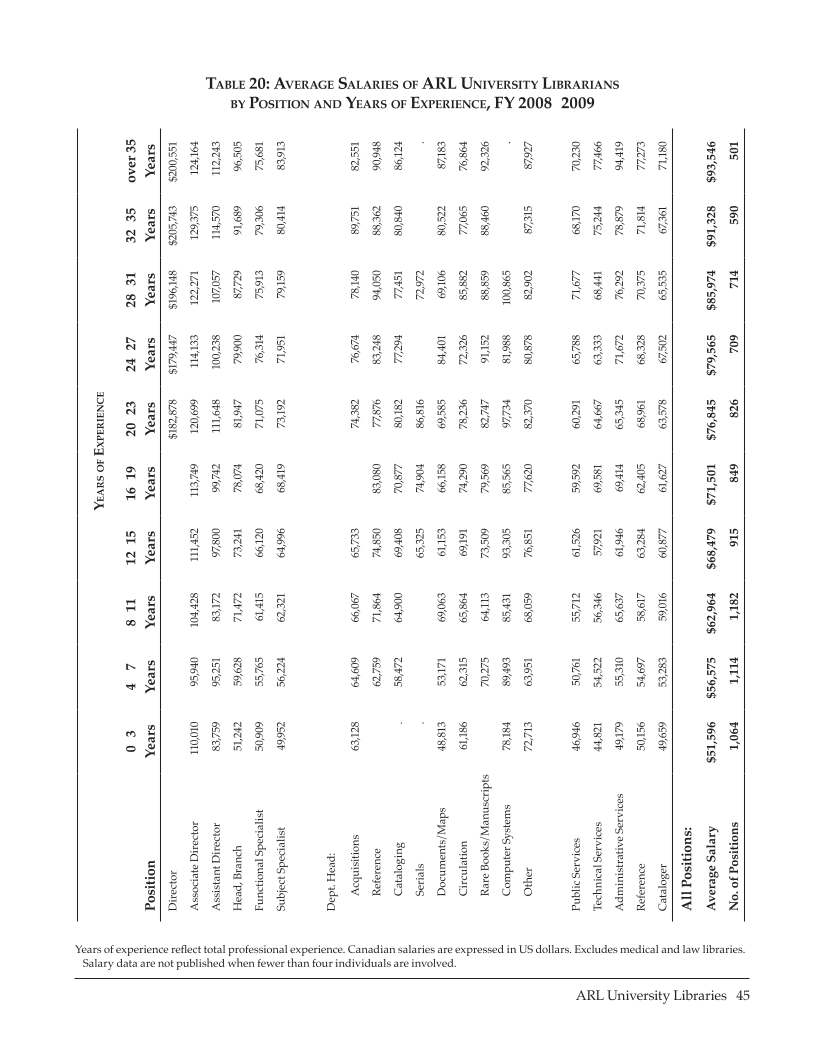
YearsofExperience Position 0–3 Years 4 – 7 Years 8–11 Years 12–15 Years 16–19 Years 20–23 Years 24–27 Years 28–31 Years 32–35 Years over 35 Years Director ‡ ‡ ‡ ‡ ‡ $182,878 $179,447 $196,148 $205,743 $200,551 Associate Director 110,010 95,940 104,428 111,452 113,749 120,699 114,133 122,271 129,375 124,164 Assistant Director 83,759 95,251 83,172 97,800 99,742 111,648 100,238 107,057 114,570 112,243 Head, Branch 51,242 59,628 71,472 73,241 78,074 81,947 79,900 87,729 91,689 96,505 Functional Specialist 50,909 55,765 61,415 66,120 68,420 71,075 76,314 75,913 79,306 75,681 Subject Specialist 49,952 56,224 62,321 64,996 68,419 73,192 71,951 79,159 80,414 83,913 Dept. Head: Acquisitions 63,128 64,609 66,067 65,733 ‡ 74,382 76,674 78,140 89,751 82,551 Reference ‡ 62,759 71,864 74,850 83,080 77,876 83,248 94,050 88,362 90,948 Cataloging . 58,472 64,900 69,408 70,877 80,182 77,294 77,451 80,840 86,124 Serials . ‡ ‡ 65,325 74,904 86,816 ‡ 72,972 ‡ . Documents/Maps 48,813 53,171 69,063 61,153 66,158 69,585 84,401 69,106 80,522 87,183 Circulation 61,186 62,315 65,864 69,191 74,290 78,236 72,326 85,882 77,065 76,864 Rare Books/Manuscripts ‡ 70,275 64,113 73,509 79,569 82,747 91,152 88,859 88,460 92,326 Computer Systems 78,184 89,493 85,431 93,305 85,565 97,734 81,988 100,865 ‡ . Other 72,713 63,951 68,059 76,851 77,620 82,370 80,878 82,902 87,315 87,927 Public Services 46,946 50,761 55,712 61,526 59,592 60,291 65,788 71,677 68,170 70,230 Technical Services 44,821 54,522 56,346 57,921 69,581 64,667 63,333 68,441 75,244 77,466 Administrative Services 49,179 55,310 65,637 61,946 69,414 65,345 71,672 76,292 78,879 94,419 Reference 50,156 54,697 58,617 63,284 62,405 68,961 68,328 70,375 71,814 77,273 Cataloger 49,659 53,283 59,016 60,877 61,627 63,578 67,502 65,535 67,361 71,180 All Positions: Average Salary $51,596 $56,575 $62,964 $68,479 $71,501 $76,845 $79,565 $85,974 $91,328 $93,546 No. of Positions 1,064 1,114 1,182 915 849 826 709 714 590 501 ARL University Libraries · 45 Table 20: Average Salaries of ARL University Librarians by Position and Years of Experience, FY 2008–2009 Years of experience reflect total professional experience. Canadian salaries are expressed in US dollars. Excludes medical and law libraries. ‡ Salary data are not published when fewer than four individuals are involved.
Help


