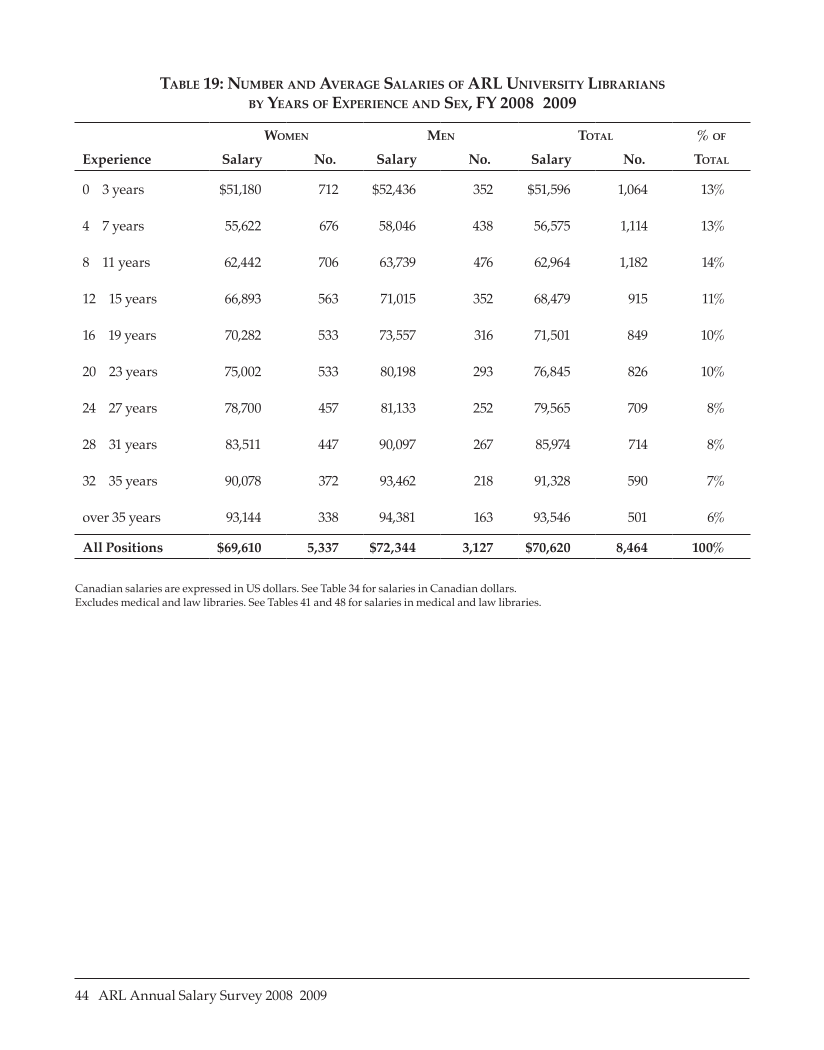
44 · ARL Annual Salary Survey 2008–2009 Table 19: Number and Average Salaries of ARL University Librarians by Years of Experience and Sex, FY 2008–2009 Canadian salaries are expressed in US dollars. See Table 34 for salaries in Canadian dollars. Excludes medical and law libraries. See Tables 41 and 48 for salaries in medical and law libraries. Experience Women Men Total % of Salary No. Salary No. Salary No. Total 0 – 3 years $51,180 712 $52,436 352 $51,596 1,064 13% 4 – 7 years 55,622 676 58,046 438 56,575 1,114 13% 8 – 11 years 62,442 706 63,739 476 62,964 1,182 14% 12 – 15 years 66,893 563 71,015 352 68,479 915 11% 16 – 19 years 70,282 533 73,557 316 71,501 849 10% 20 – 23 years 75,002 533 80,198 293 76,845 826 10% 24 – 27 years 78,700 457 81,133 252 79,565 709 8% 28 – 31 years 83,511 447 90,097 267 85,974 714 8% 32 – 35 years 90,078 372 93,462 218 91,328 590 7% over 35 years 93,144 338 94,381 163 93,546 501 6% All Positions $69,610 5,337 $72,344 3,127 $70,620 8,464 100%
Help


