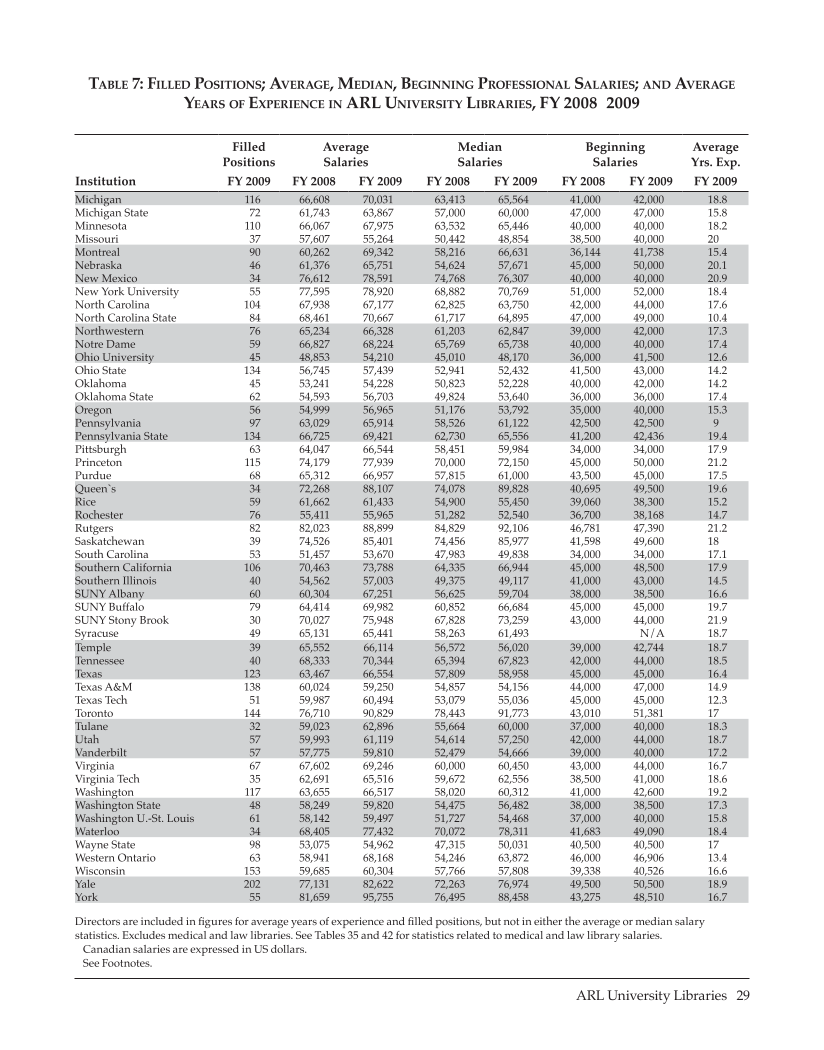
ARL University Libraries · 29 Table 7: Filled Positions Average, Median, Beginning Professional Salaries and Average Years of Experience in ARL University Libraries, FY 2008–2009 Filled Positions Average Salaries Median Salaries Beginning Salaries Average Yrs. Exp. Institution FY 2009 FY 2008 FY 2009 FY 2008 FY 2009 FY 2008 FY 2009 FY 2009 Michigan ‡ 116 66,608 70,031 63,413 65,564 41,000 42,000 18.8 Michigan State ‡ 72 61,743 63,867 57,000 60,000 47,000 47,000 15.8 Minnesota 110 66,067 67,975 63,532 65,446 40,000 40,000 18.2 Missouri ‡ 37 57,607 55,264 50,442 48,854 38,500 40,000 20 Montreal † ‡ 90 60,262 69,342 58,216 66,631 36,144 41,738 15.4 Nebraska ‡ 46 61,376 65,751 54,624 57,671 45,000 50,000 20.1 New Mexico ‡ 34 76,612 78,591 74,768 76,307 40,000 40,000 20.9 New York University ‡ 55 77,595 78,920 68,882 70,769 51,000 52,000 18.4 North Carolina ‡ 104 67,938 67,177 62,825 63,750 42,000 44,000 17.6 North Carolina State ‡ 84 68,461 70,667 61,717 64,895 47,000 49,000 10.4 Northwestern ‡ 76 65,234 66,328 61,203 62,847 39,000 42,000 17.3 Notre Dame ‡ 59 66,827 68,224 65,769 65,738 40,000 40,000 17.4 Ohio University ‡ 45 48,853 54,210 45,010 48,170 36,000 41,500 12.6 Ohio State ‡ 134 56,745 57,439 52,941 52,432 41,500 43,000 14.2 Oklahoma ‡ 45 53,241 54,228 50,823 52,228 40,000 42,000 14.2 Oklahoma State ‡ 62 54,593 56,703 49,824 53,640 36,000 36,000 17.4 Oregon ‡ 56 54,999 56,965 51,176 53,792 35,000 40,000 15.3 Pennsylvania ‡ 97 63,029 65,914 58,526 61,122 42,500 42,500 9 Pennsylvania State ‡ 134 66,725 69,421 62,730 65,556 41,200 42,436 19.4 Pittsburgh ‡ 63 64,047 66,544 58,451 59,984 34,000 34,000 17.9 Princeton ‡ 115 74,179 77,939 70,000 72,150 45,000 50,000 21.2 Purdue ‡ 68 65,312 66,957 57,815 61,000 43,500 45,000 17.5 Queen`s † ‡ 34 72,268 88,107 74,078 89,828 40,695 49,500 19.6 Rice 59 61,662 61,433 54,900 55,450 39,060 38,300 15.2 Rochester ‡ 76 55,411 55,965 51,282 52,540 36,700 38,168 14.7 Rutgers ‡ 82 82,023 88,899 84,829 92,106 46,781 47,390 21.2 Saskatchewan † ‡ 39 74,526 85,401 74,456 85,977 41,598 49,600 18 South Carolina ‡ 53 51,457 53,670 47,983 49,838 34,000 34,000 17.1 Southern California ‡ 106 70,463 73,788 64,335 66,944 45,000 48,500 17.9 Southern Illinois 40 54,562 57,003 49,375 49,117 41,000 43,000 14.5 SUNY Albany ‡ 60 60,304 67,251 56,625 59,704 38,000 38,500 16.6 SUNY Buffalo ‡ 79 64,414 69,982 60,852 66,684 45,000 45,000 19.7 SUNY Stony Brook ‡ 30 70,027 75,948 67,828 73,259 43,000 44,000 21.9 Syracuse ‡ 49 65,131 65,441 58,263 61,493 N/A 18.7 Temple ‡ 39 65,552 66,114 56,572 56,020 39,000 42,744 18.7 Tennessee ‡ 40 68,333 70,344 65,394 67,823 42,000 44,000 18.5 Texas ‡ 123 63,467 66,554 57,809 58,958 45,000 45,000 16.4 Texas A&M ‡ 138 60,024 59,250 54,857 54,156 44,000 47,000 14.9 Texas Tech ‡ 51 59,987 60,494 53,079 55,036 45,000 45,000 12.3 Toronto † ‡ 144 76,710 90,829 78,443 91,773 43,010 51,381 17 Tulane 32 59,023 62,896 55,664 60,000 37,000 40,000 18.3 Utah‡ 57 59,993 61,119 54,614 57,250 42,000 44,000 18.7 Vanderbilt ‡ 57 57,775 59,810 52,479 54,666 39,000 40,000 17.2 Virginia ‡ 67 67,602 69,246 60,000 60,450 43,000 44,000 16.7 Virginia Tech 35 62,691 65,516 59,672 62,556 38,500 41,000 18.6 Washington ‡ 117 63,655 66,517 58,020 60,312 41,000 42,600 19.2 Washington State ‡ 48 58,249 59,820 54,475 56,482 38,000 38,500 17.3 Washington U.-St. Louis ‡ 61 58,142 59,497 51,727 54,468 37,000 40,000 15.8 Waterloo † ‡ 34 68,405 77,432 70,072 78,311 41,683 49,090 18.4 Wayne State ‡ 98 53,075 54,962 47,315 50,031 40,500 40,500 17 Western Ontario † ‡ 63 58,941 68,168 54,246 63,872 46,000 46,906 13.4 Wisconsin ‡ 153 59,685 60,304 57,766 57,808 39,338 40,526 16.6 Yale † ‡ 202 77,131 82,622 72,263 76,974 49,500 50,500 18.9 York † 55 81,659 95,755 76,495 88,458 43,275 48,510 16.7 Directors are included in figures for average years of experience and filled positions, but not in either the average or median salary statistics. Excludes medical and law libraries. See Tables 35 and 42 for statistics related to medical and law library salaries. † Canadian salaries are expressed in US dollars. ‡ See Footnotes.
Help


