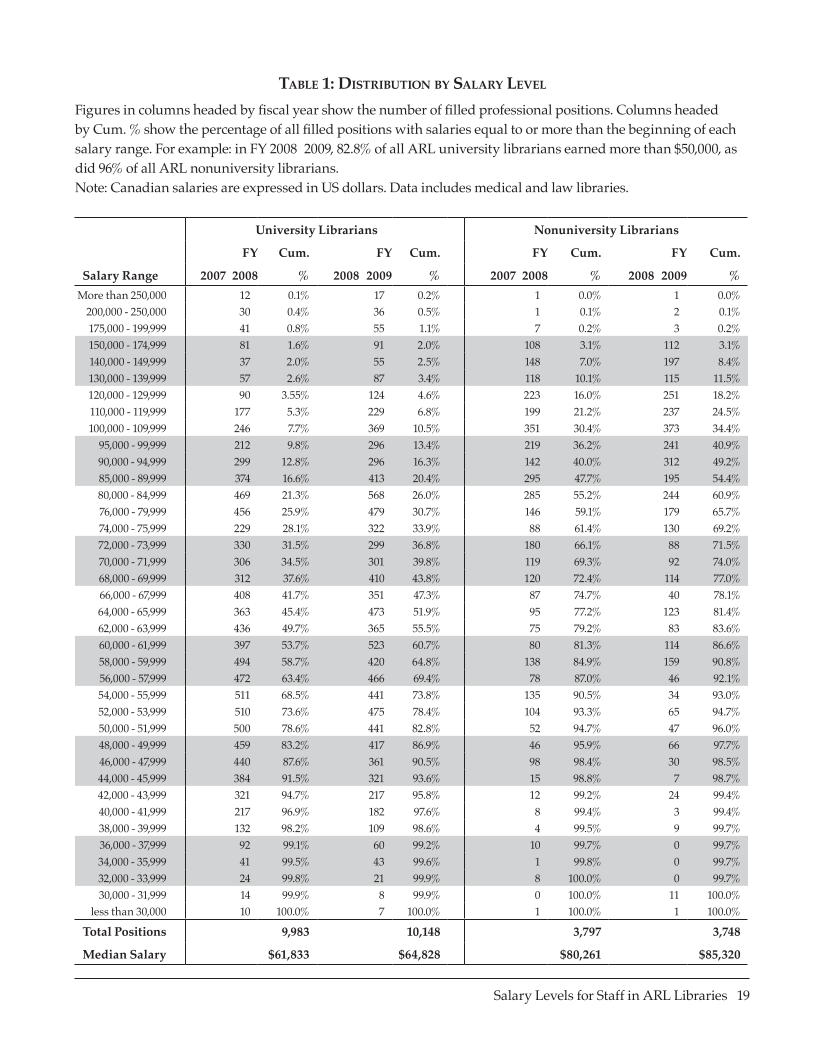
Salary Levels for Staff in ARL Libraries · 19 Table 1: Distribution by Salary Level Figures in columns headed by fiscal year show the number of filled professional positions. Columns headed by Cum. % show the percentage of all filled positions with salaries equal to or more than the beginning of each salary range. For example: in FY 2008–2009, 82.8% of all ARL university librarians earned more than $50,000, as did 96% of all ARL nonuniversity librarians. Note: Canadian salaries are expressed in US dollars. Data includes medical and law libraries. University Librarians Nonuniversity Librarians FY Cum. FY Cum. FY Cum. FY Cum. Salary Range 2007–2008 % 2008–2009 % 2007–2008 % 2008–2009 % More than 250,000 12 0.1% 17 0.2% 1 0.0% 1 0.0% 200,000 - 250,000 30 0.4% 36 0.5% 1 0.1% 2 0.1% 175,000 - 199,999 41 0.8% 55 1.1% 7 0.2% 3 0.2% 150,000 - 174,999 81 1.6% 91 2.0% 108 3.1% 112 3.1% 140,000 - 149,999 37 2.0% 55 2.5% 148 7.0% 197 8.4% 130,000 - 139,999 57 2.6% 87 3.4% 118 10.1% 115 11.5% 120,000 - 129,999 90 3.55% 124 4.6% 223 16.0% 251 18.2% 110,000 - 119,999 177 5.3% 229 6.8% 199 21.2% 237 24.5% 100,000 - 109,999 246 7.7% 369 10.5% 351 30.4% 373 34.4% 95,000 - 99,999 212 9.8% 296 13.4% 219 36.2% 241 40.9% 90,000 - 94,999 299 12.8% 296 16.3% 142 40.0% 312 49.2% 85,000 - 89,999 374 16.6% 413 20.4% 295 47.7% 195 54.4% 80,000 - 84,999 469 21.3% 568 26.0% 285 55.2% 244 60.9% 76,000 - 79,999 456 25.9% 479 30.7% 146 59.1% 179 65.7% 74,000 - 75,999 229 28.1% 322 33.9% 88 61.4% 130 69.2% 72,000 - 73,999 330 31.5% 299 36.8% 180 66.1% 88 71.5% 70,000 - 71,999 306 34.5% 301 39.8% 119 69.3% 92 74.0% 68,000 - 69,999 312 37.6% 410 43.8% 120 72.4% 114 77.0% 66,000 - 67,999 408 41.7% 351 47.3% 87 74.7% 40 78.1% 64,000 - 65,999 363 45.4% 473 51.9% 95 77.2% 123 81.4% 62,000 - 63,999 436 49.7% 365 55.5% 75 79.2% 83 83.6% 60,000 - 61,999 397 53.7% 523 60.7% 80 81.3% 114 86.6% 58,000 - 59,999 494 58.7% 420 64.8% 138 84.9% 159 90.8% 56,000 - 57,999 472 63.4% 466 69.4% 78 87.0% 46 92.1% 54,000 - 55,999 511 68.5% 441 73.8% 135 90.5% 34 93.0% 52,000 - 53,999 510 73.6% 475 78.4% 104 93.3% 65 94.7% 50,000 - 51,999 500 78.6% 441 82.8% 52 94.7% 47 96.0% 48,000 - 49,999 459 83.2% 417 86.9% 46 95.9% 66 97.7% 46,000 - 47,999 440 87.6% 361 90.5% 98 98.4% 30 98.5% 44,000 - 45,999 384 91.5% 321 93.6% 15 98.8% 7 98.7% 42,000 - 43,999 321 94.7% 217 95.8% 12 99.2% 24 99.4% 40,000 - 41,999 217 96.9% 182 97.6% 8 99.4% 3 99.4% 38,000 - 39,999 132 98.2% 109 98.6% 4 99.5% 9 99.7% 36,000 - 37,999 92 99.1% 60 99.2% 10 99.7% 0 99.7% 34,000 - 35,999 41 99.5% 43 99.6% 1 99.8% 0 99.7% 32,000 - 33,999 24 99.8% 21 99.9% 8 100.0% 0 99.7% 30,000 - 31,999 14 99.9% 8 99.9% 0 100.0% 11 100.0% less than 30,000 10 100.0% 7 100.0% 1 100.0% 1 100.0% Total Positions 9,983 10,148 3,797 3,748 Median Salary $61,833 $64,828 $80,261 $85,320
Help


