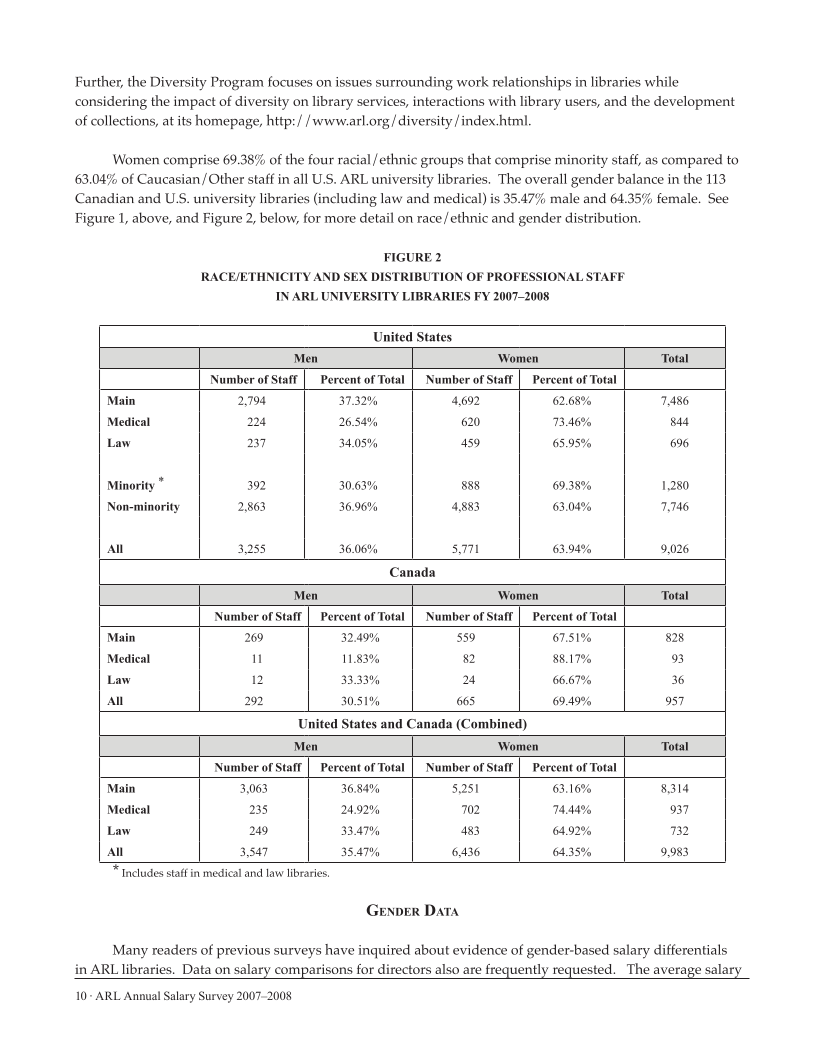
10 · ARL Annual Salary Survey 2007–2008 Further, the Diversity Program focuses on issues surrounding work relationships in libraries while considering the impact of diversity on library services, interactions with library users, and the development of collections, at its homepage, http://www.arl.org/diversity/index.html. Women comprise 69.38% of the four racial/ethnic groups that comprise minority staff, as compared to 63.04% of Caucasian/Other staff in all U.S. ARL university libraries. The overall gender balance in the 113 Canadian and U.S. university libraries (including law and medical) is 35.47% male and 64.35% female. See Figure 1, above, and Figure 2, below, for more detail on race/ethnic and gender distribution. FIGURE 2 RACE/ETHNICITY AND SEX DISTRIBUTION OF PROFESSIONAL STAFF IN ARL UNIVERSITY LIBRARIES FY 2007–2008 United States Men Women Total Number of Staff Percent of Total Number of Staff Percent of Total Main 2,794 37.32% 4,692 62.68% 7,486 Medical 224 26.54% 620 73.46% 844 Law 237 34.05% 459 65.95% 696 Minority * 392 30.63% 888 69.38% 1,280 Non-minority 2,863 36.96% 4,883 63.04% 7,746 All 3,255 36.06% 5,771 63.94% 9,026 Canada Men Women Total Number of Staff Percent of Total Number of Staff Percent of Total Main 269 32.49% 559 67.51% 828 Medical 11 11.83% 82 88.17% 93 Law 12 33.33% 24 66.67% 36 All 292 30.51% 665 69.49% 957 United States and Canada (Combined) Men Women Total Number of Staff Percent of Total Number of Staff Percent of Total Main 3,063 36.84% 5,251 63.16% 8,314 Medical 235 24.92% 702 74.44% 937 Law 249 33.47% 483 64.92% 732 All 3,547 35.47% 6,436 64.35% 9,983 * Includes staff in medical and law libraries. Gender Data Many readers of previous surveys have inquired about evidence of gender-based salary differentials in ARL libraries. Data on salary comparisons for directors also are frequently requested. The average salary
Help


