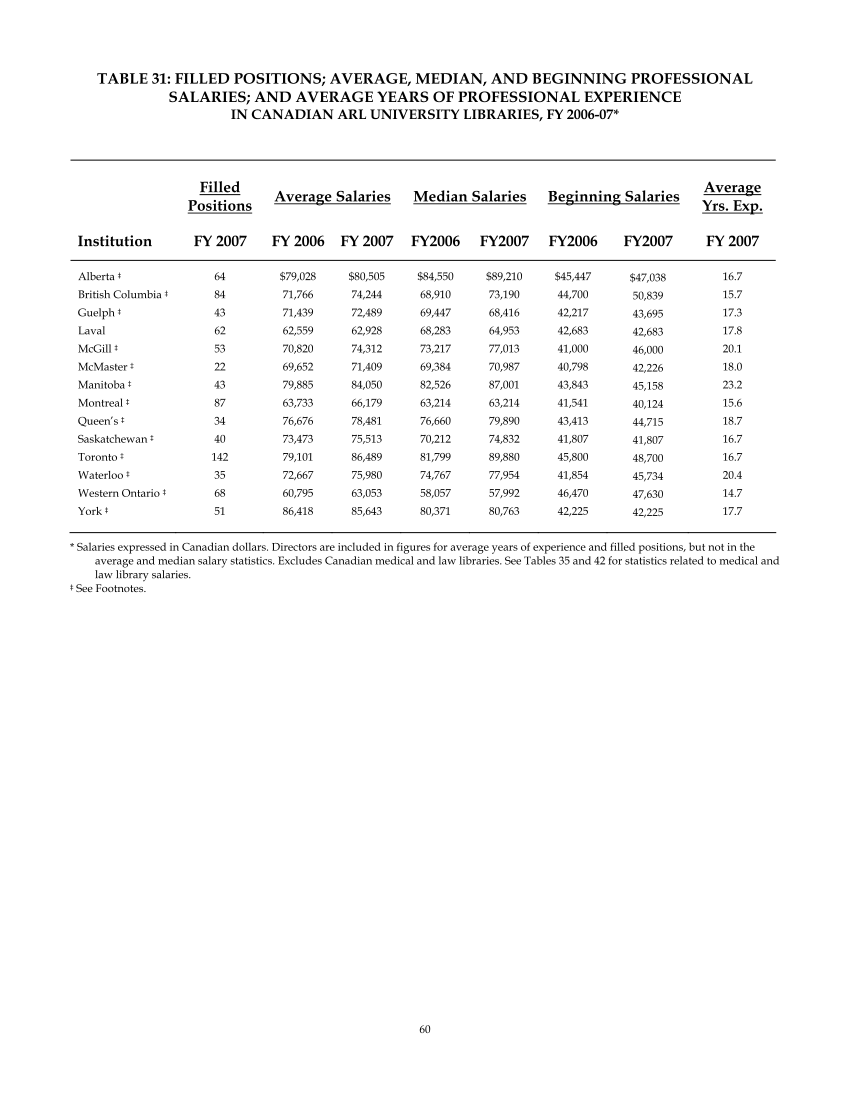
60 TABLE 31: FILLED POSITIONS AVERAGE, MEDIAN, AND BEGINNING PROFESSIONAL SALARIES AND AVERAGE YEARS OF PROFESSIONAL EXPERIENCE IN CANADIAN ARL UNIVERSITY LIBRARIES, FY 2006-07* Filled Positions Average Salaries Median Salaries Beginning Salaries Average Yrs. Exp. Institution FY 2007 FY 2006 FY 2007 FY2006 FY2007 FY2006 FY2007 FY 2007 Alberta ‡ 64 $79,028 $80,505 $84,550 $89,210 $45,447 $47,038 16.7 British Columbia ‡ 84 71,766 74,244 68,910 73,190 44,700 50,839 15.7 Guelph ‡ 43 71,439 72,489 69,447 68,416 42,217 43,695 17.3 Laval 62 62,559 62,928 68,283 64,953 42,683 42,683 17.8 McGill ‡ 53 70,820 74,312 73,217 77,013 41,000 46,000 20.1 McMaster ‡ 22 69,652 71,409 69,384 70,987 40,798 42,226 18.0 Manitoba ‡ 43 79,885 84,050 82,526 87,001 43,843 45,158 23.2 Montreal ‡ 87 63,733 66,179 63,214 63,214 41,541 40,124 15.6 Queen’s ‡ 34 76,676 78,481 76,660 79,890 43,413 44,715 18.7 Saskatchewan ‡ 40 73,473 75,513 70,212 74,832 41,807 41,807 16.7 Toronto ‡ 142 79,101 86,489 81,799 89,880 45,800 48,700 16.7 Waterloo ‡ 35 72,667 75,980 74,767 77,954 41,854 45,734 20.4 Western Ontario ‡ 68 60,795 63,053 58,057 57,992 46,470 47,630 14.7 York ‡ 51 86,418 85,643 80,371 80,763 42,225 42,225 17.7 * Salaries expressed in Canadian dollars. Directors are included in figures for average years of experience and filled positions, but not in the average and median salary statistics. Excludes Canadian medical and law libraries. See Tables 35 and 42 for statistics related to medical and law library salaries. ‡ See Footnotes.
Help


