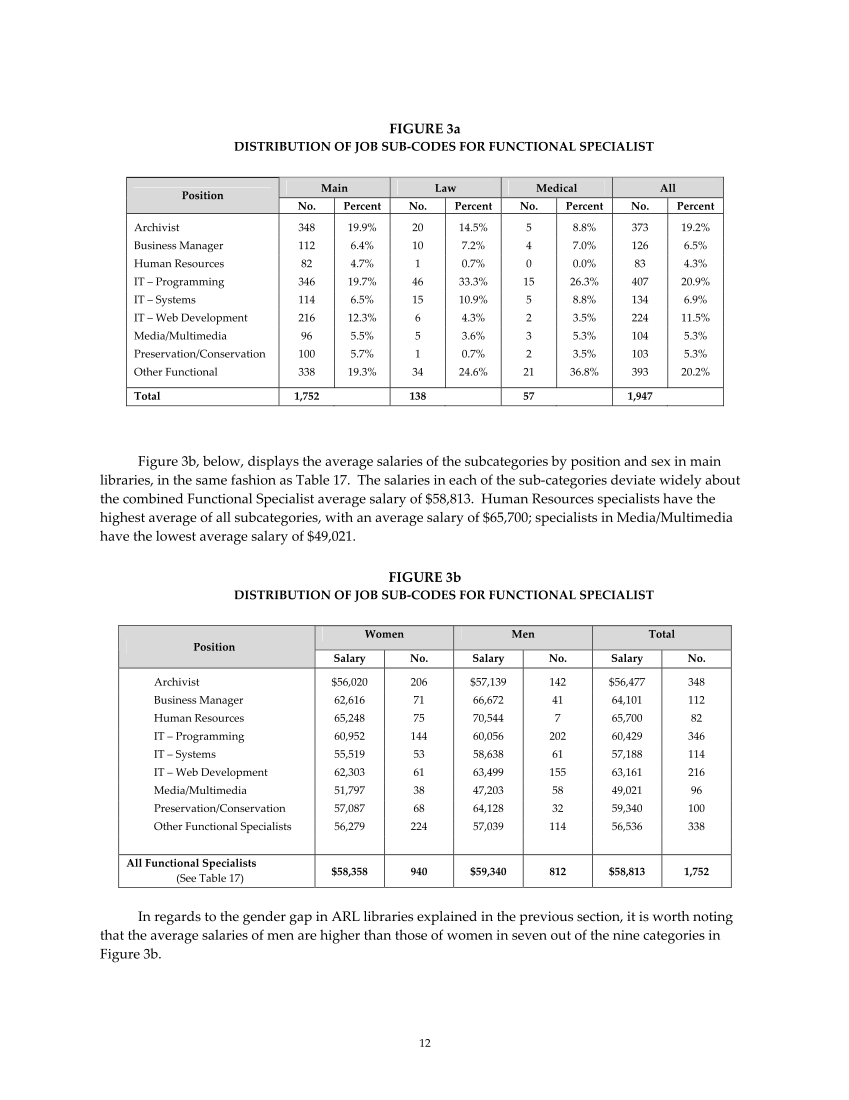
12 FIGURE 3a DISTRIBUTION OF JOB SUB‐CODES FOR FUNCTIONAL SPECIALIST Main Law Medical All Position No. Percent No. Percent No. Percent No. Percent Archivist 348 19.9% 20 14.5% 5 8.8% 373 19.2% Business Manager 112 6.4% 10 7.2% 4 7.0% 126 6.5% Human Resources 82 4.7% 1 0.7% 0 0.0% 83 4.3% IT – Programming 346 19.7% 46 33.3% 15 26.3% 407 20.9% IT – Systems 114 6.5% 15 10.9% 5 8.8% 134 6.9% IT – Web Development 216 12.3% 6 4.3% 2 3.5% 224 11.5% Media/Multimedia 96 5.5% 5 3.6% 3 5.3% 104 5.3% Preservation/Conservation 100 5.7% 1 0.7% 2 3.5% 103 5.3% Other Functional 338 19.3% 34 24.6% 21 36.8% 393 20.2% Total 1,752 138 57 1,947 Figure 3b, below, displays the average salaries of the subcategories by position and sex in main libraries, in the same fashion as Table 17. The salaries in each of the sub‐categories deviate widely about the combined Functional Specialist average salary of $58,813. Human Resources specialists have the highest average of all subcategories, with an average salary of $65,700 specialists in Media/Multimedia have the lowest average salary of $49,021. FIGURE 3b DISTRIBUTION OF JOB SUB‐CODES FOR FUNCTIONAL SPECIALIST Women Men Total Position Salary No. Salary No. Salary No. Archivist $56,020 206 $57,139 142 $56,477 348 Business Manager 62,616 71 66,672 41 64,101 112 Human Resources 65,248 75 70,544 7 65,700 82 IT – Programming 60,952 144 60,056 202 60,429 346 IT – Systems 55,519 53 58,638 61 57,188 114 IT – Web Development 62,303 61 63,499 155 63,161 216 Media/Multimedia 51,797 38 47,203 58 49,021 96 Preservation/Conservation 57,087 68 64,128 32 59,340 100 Other Functional Specialists 56,279 224 57,039 114 56,536 338 All Functional Specialists (See Table 17) $58,358 940 $59,340 812 $58,813 1,752 In regards to the gender gap in ARL libraries explained in the previous section, it is worth noting that the average salaries of men are higher than those of women in seven out of the nine categories in Figure 3b.
Help


