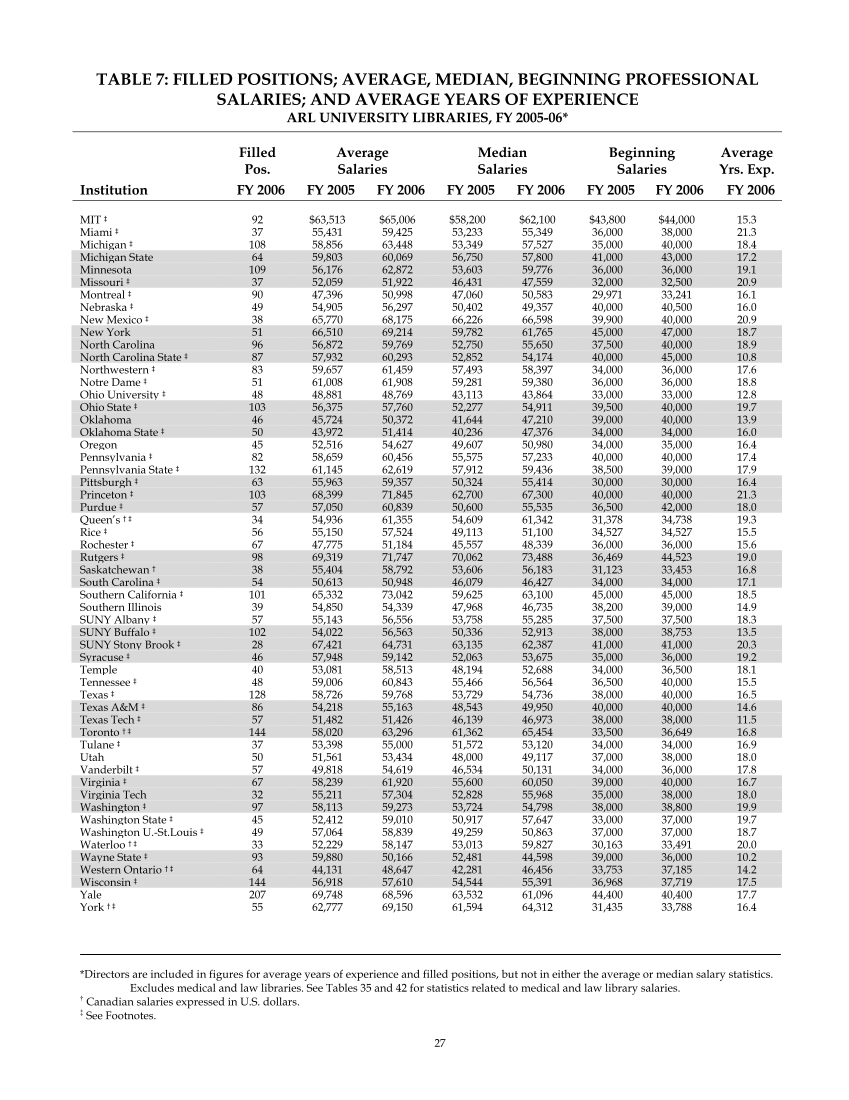
*Directors are included in figures for average years of experience and filled positions, but not in either the average or median salary statistics. Excludes medical and law libraries. See Tables 35 and 42 for statistics related to medical and law library salaries. † Canadian salaries expressed in U.S. dollars. ‡ See Footnotes. 27 TABLE 7: FILLED POSITIONS AVERAGE, MEDIAN, BEGINNING PROFESSIONAL SALARIES AND AVERAGE YEARS OF EXPERIENCE ARL UNIVERSITY LIBRARIES, FY 2005-06* Filled Pos. Average Salaries Median Salaries Beginning Salaries Average Yrs. Exp. Institution FY 2006 FY 2005 FY 2006 FY 2005 FY 2006 FY 2005 FY 2006 FY 2006 MIT ‡ 92 $63,513 $65,006 $58,200 $62,100 $43,800 $44,000 15.3 Miami ‡ 37 55,431 59,425 53,233 55,349 36,000 38,000 21.3 Michigan ‡ 108 58,856 63,448 53,349 57,527 35,000 40,000 18.4 Michigan State 64 59,803 60,069 56,750 57,800 41,000 43,000 17.2 Minnesota 109 56,176 62,872 53,603 59,776 36,000 36,000 19.1 Missouri ‡ 37 52,059 51,922 46,431 47,559 32,000 32,500 20.9 Montreal ‡ 90 47,396 50,998 47,060 50,583 29,971 33,241 16.1 Nebraska ‡ 49 54,905 56,297 50,402 49,357 40,000 40,500 16.0 New Mexico ‡ 38 65,770 68,175 66,226 66,598 39,900 40,000 20.9 New York 51 66,510 69,214 59,782 61,765 45,000 47,000 18.7 North Carolina 96 56,872 59,769 52,750 55,650 37,500 40,000 18.9 North Carolina State ‡ 87 57,932 60,293 52,852 54,174 40,000 45,000 10.8 Northwestern ‡ 83 59,657 61,459 57,493 58,397 34,000 36,000 17.6 Notre Dame ‡ 51 61,008 61,908 59,281 59,380 36,000 36,000 18.8 Ohio University ‡ 48 48,881 48,769 43,113 43,864 33,000 33,000 12.8 Ohio State ‡ 103 56,375 57,760 52,277 54,911 39,500 40,000 19.7 Oklahoma 46 45,724 50,372 41,644 47,210 39,000 40,000 13.9 Oklahoma State ‡ 50 43,972 51,414 40,236 47,376 34,000 34,000 16.0 Oregon 45 52,516 54,627 49,607 50,980 34,000 35,000 16.4 Pennsylvania ‡ 82 58,659 60,456 55,575 57,233 40,000 40,000 17.4 Pennsylvania State ‡ 132 61,145 62,619 57,912 59,436 38,500 39,000 17.9 Pittsburgh ‡ 63 55,963 59,357 50,324 55,414 30,000 30,000 16.4 Princeton ‡ 103 68,399 71,845 62,700 67,300 40,000 40,000 21.3 Purdue ‡ 57 57,050 60,839 50,600 55,535 36,500 42,000 18.0 Queen’s † ‡ 34 54,936 61,355 54,609 61,342 31,378 34,738 19.3 Rice ‡ 56 55,150 57,524 49,113 51,100 34,527 34,527 15.5 Rochester ‡ 67 47,775 51,184 45,557 48,339 36,000 36,000 15.6 Rutgers ‡ 98 69,319 71,747 70,062 73,488 36,469 44,523 19.0 Saskatchewan † 38 55,404 58,792 53,606 56,183 31,123 33,453 16.8 South Carolina ‡ 54 50,613 50,948 46,079 46,427 34,000 34,000 17.1 Southern California ‡ 101 65,332 73,042 59,625 63,100 45,000 45,000 18.5 Southern Illinois 39 54,850 54,339 47,968 46,735 38,200 39,000 14.9 SUNY Albany ‡ 57 55,143 56,556 53,758 55,285 37,500 37,500 18.3 SUNY Buffalo ‡ 102 54,022 56,563 50,336 52,913 38,000 38,753 13.5 SUNY Stony Brook ‡ 28 67,421 64,731 63,135 62,387 41,000 41,000 20.3 Syracuse ‡ 46 57,948 59,142 52,063 53,675 35,000 36,000 19.2 Temple 40 53,081 58,513 48,194 52,688 34,000 36,500 18.1 Tennessee ‡ 48 59,006 60,843 55,466 56,564 36,500 40,000 15.5 Texas ‡ 128 58,726 59,768 53,729 54,736 38,000 40,000 16.5 Texas A&M ‡ 86 54,218 55,163 48,543 49,950 40,000 40,000 14.6 Texas Tech ‡ 57 51,482 51,426 46,139 46,973 38,000 38,000 11.5 Toronto † ‡ 144 58,020 63,296 61,362 65,454 33,500 36,649 16.8 Tulane ‡ 37 53,398 55,000 51,572 53,120 34,000 34,000 16.9 Utah 50 51,561 53,434 48,000 49,117 37,000 38,000 18.0 Vanderbilt ‡ 57 49,818 54,619 46,534 50,131 34,000 36,000 17.8 Virginia ‡ 67 58,239 61,920 55,600 60,050 39,000 40,000 16.7 Virginia Tech 32 55,211 57,304 52,828 55,968 35,000 38,000 18.0 Washington ‡ 97 58,113 59,273 53,724 54,798 38,000 38,800 19.9 Washington State ‡ 45 52,412 59,010 50,917 57,647 33,000 37,000 19.7 Washington U.-St.Louis ‡ 49 57,064 58,839 49,259 50,863 37,000 37,000 18.7 Waterloo † ‡ 33 52,229 58,147 53,013 59,827 30,163 33,491 20.0 Wayne State ‡ 93 59,880 50,166 52,481 44,598 39,000 36,000 10.2 Western Ontario † ‡ 64 44,131 48,647 42,281 46,456 33,753 37,185 14.2 Wisconsin ‡ 144 56,918 57,610 54,544 55,391 36,968 37,719 17.5 Yale 207 69,748 68,596 63,532 61,096 44,400 40,400 17.7 York † ‡ 55 62,777 69,150 61,594 64,312 31,435 33,788 16.4
Help


